
Operation Manual

Vigor2926 Series User’s Guide
602
V
V
I
I
I
I
-
-
6
6
-
-
6
6
T
T
r
r
a
a
f
f
f
f
i
i
c
c
G
G
r
r
a
a
p
p
h
h
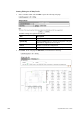
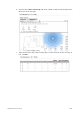
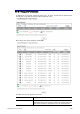
Click Traffic Graph to open the web page. Choose one of the managed Access Points, LAN-A
or LAN-B, daily or weekly for viewing data transmission chart. Click Refresh to renew the
graph at any time.
The horizontal axis represents time; the vertical axis represents the transmission rate (in
kbps).
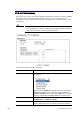
Info
Enabling/Disabling such function will also enable/disable the External
Devices function.