
User manual


59Presentation of graphs and tables
DE Dostmann Electronic GmbH
5.1 Graph and table
The presentation can be displayed either as a two-dimensional line graph or in 3D
view. With regard to the 2D presentation the line widths can be changed. The table
can optionally be displayed next to the graph or below the graph.
Minimum, maximum and average value
The minimum, maximum and average values of the recorded data are displayed
next to the table (in 5.1.1) or above the table (for 5.1.2). These values are
continuously updated during the acquisition process. When loading an existing file,
these values are recalculated and displayed.
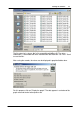
5.1.1 Graph and table side by side
The table is shown next to the graph. The table width always remains the same when
changing the window size.