
User Manual

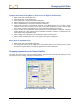
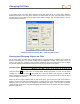
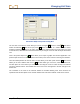

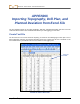
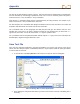
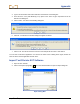
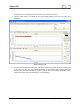
Table Of Contents
- Operator’s Manual
- Digital
- Control
- Incorporated
- Safety Precautions and Warnings
- Introduction
- System Components
- Startup and Operating Instructions
- SST Operating Procedure
- Setting Up SST Laptop
- Setting Up Equipment and Site
- 2. Establish Borepath Reference Line and Mark Borepath
- 3. Assemble and Torque-up Non-Magnetic Housing to Non-Mag Tool
- 4. Align Drill to Marked Borepath
- 5. Position & Align Non-mag Tooling Assembly onto Marked Borepath
- 6. Stage SST Equipment and Power Sources Adjacent to Tooling Assembly
- 7. Power Up Eclipse SST Equipment
- 8. Measure SST Transmitter Current Draw
- 9. Install SST Transmitter into Aligned Non-mag Tooling Assembly
- Setting Reference Heading (Ref Yaw) and Roll Offset
- Calibrating SST Tool and Confirming Proper System Operation
- Logging Drill Run
- Summary of Basic Operating Procedure
- SST Operating Procedure
- Computer Software Instructions
- Inputting and Changing Drill Data
- APPENDIXImporting Topography, Drill Plan, and Planned Deviation from Excel File
- LIMITED WARRANTY
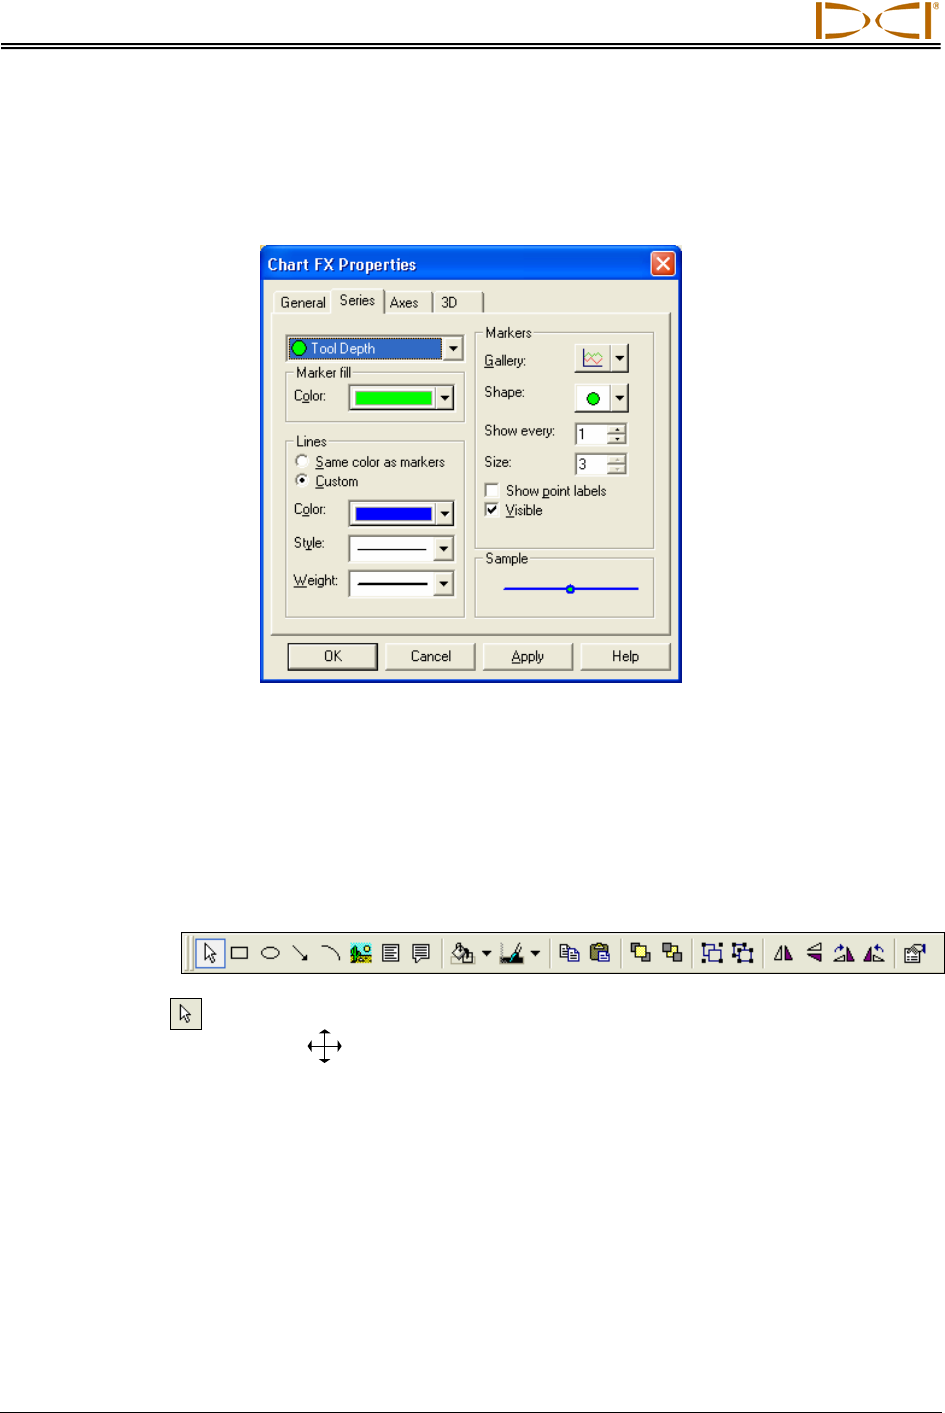
Changing Drill Data
In the graphic above, the Series tab is selected and the drop-down list for the top left field is clicked to
display the four plots. Once one plot is selected, as shown below, the color, size, and shape of the line
and data points for that plot can be changed. After making changes, click the Apply button to see the
desired changes take effect.
Chart FX Properties Dialog Box – Selecting Plot to Edit
Drawing and Changing Objects on Plots
The annotate toolbar provides tools for drawing objects, importing artwork, or adding text to either the
Profile or Deviation plot. The annotate toolbar must be displayed to enable you to select an icon or
function. See “Plot Area Toolbars” in the Computer Instructions section for information on how to display
the annotate toolbar and descriptions of the icons or functions provided on the toolbar.
Annotate Toolbar:
Using the pointer
, you can select an existing object. Moving the pointer or cursor over an object
changes it to a four-arrow cursor
and allows you to select the object. Once selected, an object will
have a shaded line and handles (or little black squares) around it, and you will be able to drag the object
around or enlarge or reduce it.
When you have an object selected with the four-arrow cursor, you can click the right mouse button to
display a popup menu with more drawing options, including access to the Annotation Object Properties
dialog box. You can also access this dialog box, which allows more ways to edit the object, by double-
clicking the four-arrow cursor or by right clicking with the four-arrow cursor and then selecting Properties...
from the popup menu.
54 Eclipse
®
SST
®
Operator’s Manual