
User Manual
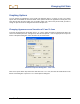

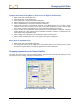
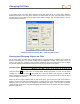

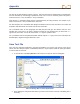
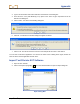
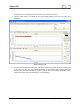
Table Of Contents
- Operator’s Manual
- Digital
- Control
- Incorporated
- Safety Precautions and Warnings
- Introduction
- System Components
- Startup and Operating Instructions
- SST Operating Procedure
- Setting Up SST Laptop
- Setting Up Equipment and Site
- 2. Establish Borepath Reference Line and Mark Borepath
- 3. Assemble and Torque-up Non-Magnetic Housing to Non-Mag Tool
- 4. Align Drill to Marked Borepath
- 5. Position & Align Non-mag Tooling Assembly onto Marked Borepath
- 6. Stage SST Equipment and Power Sources Adjacent to Tooling Assembly
- 7. Power Up Eclipse SST Equipment
- 8. Measure SST Transmitter Current Draw
- 9. Install SST Transmitter into Aligned Non-mag Tooling Assembly
- Setting Reference Heading (Ref Yaw) and Roll Offset
- Calibrating SST Tool and Confirming Proper System Operation
- Logging Drill Run
- Summary of Basic Operating Procedure
- SST Operating Procedure
- Computer Software Instructions
- Inputting and Changing Drill Data
- APPENDIXImporting Topography, Drill Plan, and Planned Deviation from Excel File
- LIMITED WARRANTY
Changing Drill Data
Change Horizontal Scale (Move Y-Axis to Left or Right in Profile Plot)
1. Right mouse click in Profile plot area.
2. Select Properties... from popup menu.
3. Click on Axes tab in Chart FX Properties dialog box.
4. Click on drop-down arrow in upper left field and select X Axis.
5. Click on Details button to open X Axis Properties dialog box.
6. Under Scale tab (which is automatically selected), in the Minimum box, type in a value, usually
negative, to move the y-axis to the left or right. A zero value will place the y-axis at the left edge
of the graph; a positive value will place the y-axis outside the graph area to the left.
7. Type in a value for the Maximum, which specifies the horizontal distance displayed. The ideal
number will be just a little greater than the borepath’s maximum x-distance, as displayed in the
xDist column in the Logged Data field.
8. Click on Apply to see the plot shift according to the values you have input.
9. Click on OK to exit dialog box, then on OK again to exit Chart FX dialog box.
Move Axes in Deviation Plot
1. Right mouse click in the Deviation plot area.
2. You will get the same series of dialog boxes as described above for the Profile plot area. Follow
the instructions given above to change the appearance of the Deviation plot.
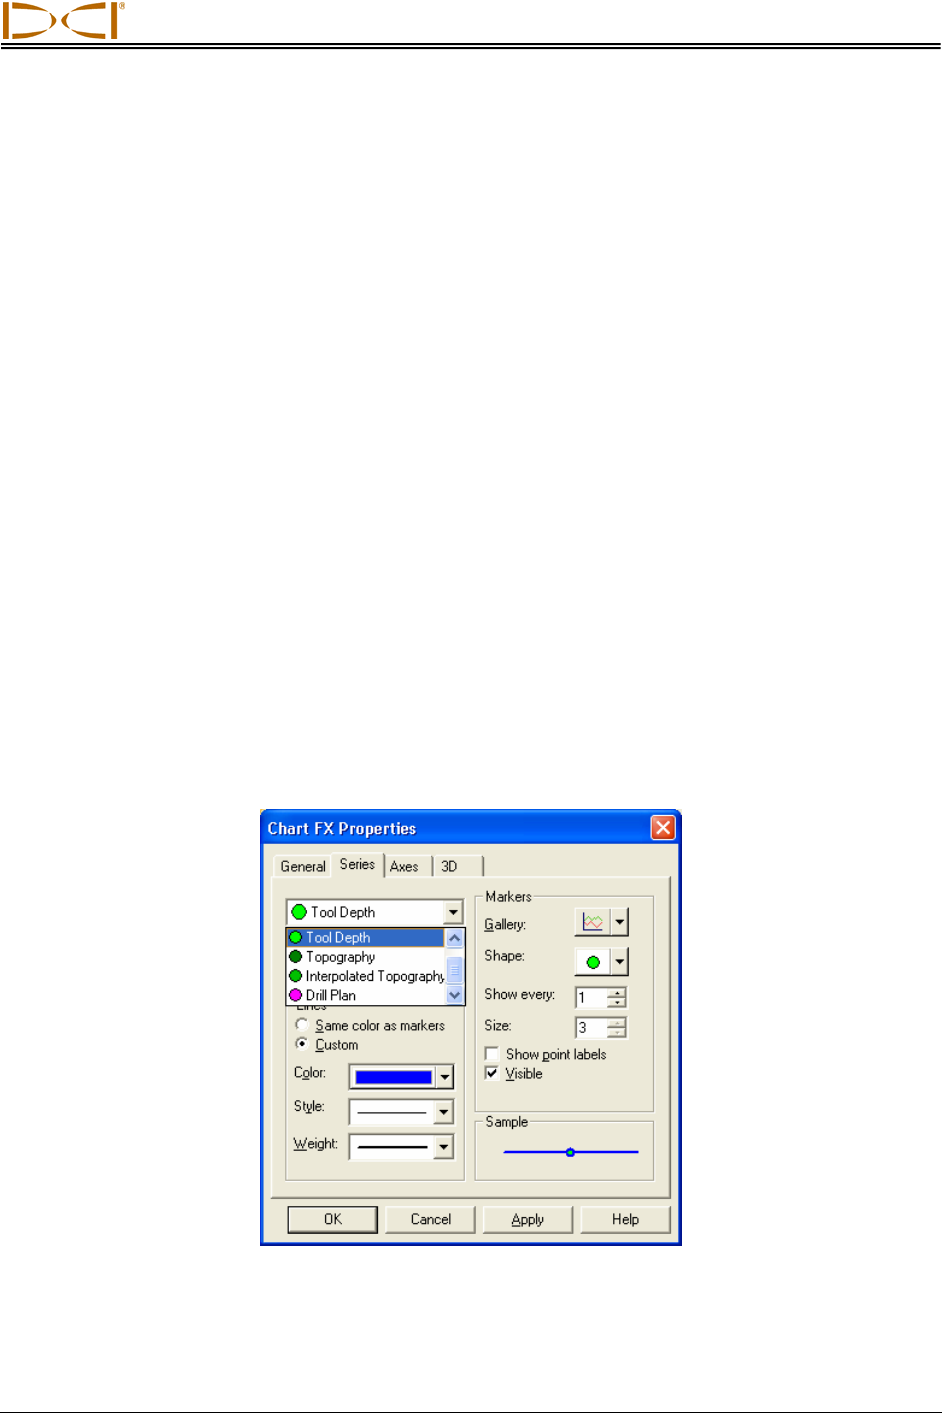
Changing Appearance of Plotted Profiles
To change the color scheme used in the plotted profiles, open the Chart FX Properties dialog box in the
plot area you want to change, and click on the Series tab.
Chart FX Properties Dialog Box – Series Tab
Eclipse
®
SST
®
Operator’s Manual 53