
User Manual

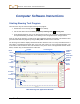
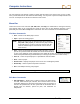
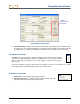
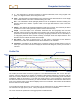
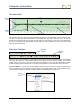
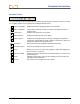
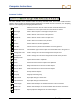
Table Of Contents
- Operator’s Manual
- Digital
- Control
- Incorporated
- Safety Precautions and Warnings
- Introduction
- System Components
- Startup and Operating Instructions
- SST Operating Procedure
- Setting Up SST Laptop
- Setting Up Equipment and Site
- 2. Establish Borepath Reference Line and Mark Borepath
- 3. Assemble and Torque-up Non-Magnetic Housing to Non-Mag Tool
- 4. Align Drill to Marked Borepath
- 5. Position & Align Non-mag Tooling Assembly onto Marked Borepath
- 6. Stage SST Equipment and Power Sources Adjacent to Tooling Assembly
- 7. Power Up Eclipse SST Equipment
- 8. Measure SST Transmitter Current Draw
- 9. Install SST Transmitter into Aligned Non-mag Tooling Assembly
- Setting Reference Heading (Ref Yaw) and Roll Offset
- Calibrating SST Tool and Confirming Proper System Operation
- Logging Drill Run
- Summary of Basic Operating Procedure
- SST Operating Procedure
- Computer Software Instructions
- Inputting and Changing Drill Data
- APPENDIXImporting Topography, Drill Plan, and Planned Deviation from Excel File
- LIMITED WARRANTY
Computer Instructions
Deviation Plot
Start of
Bore
OnBa
r
lines
Cursor Coordinates Borepath
The Deviation plot area shows the lateral (left/right) deviation of the transmitter from the reference line.
The plot is at the same horizontal position as the Profile plot, but from a bird’s-eye view. As with the
Profile plot, this window has an automatic scaling feature to keep the plot “on the chart.” The OnBar lines
and cursor coordinates will appear whenever you place the cursor anywhere in the chart area and hold
down the left mouse button.
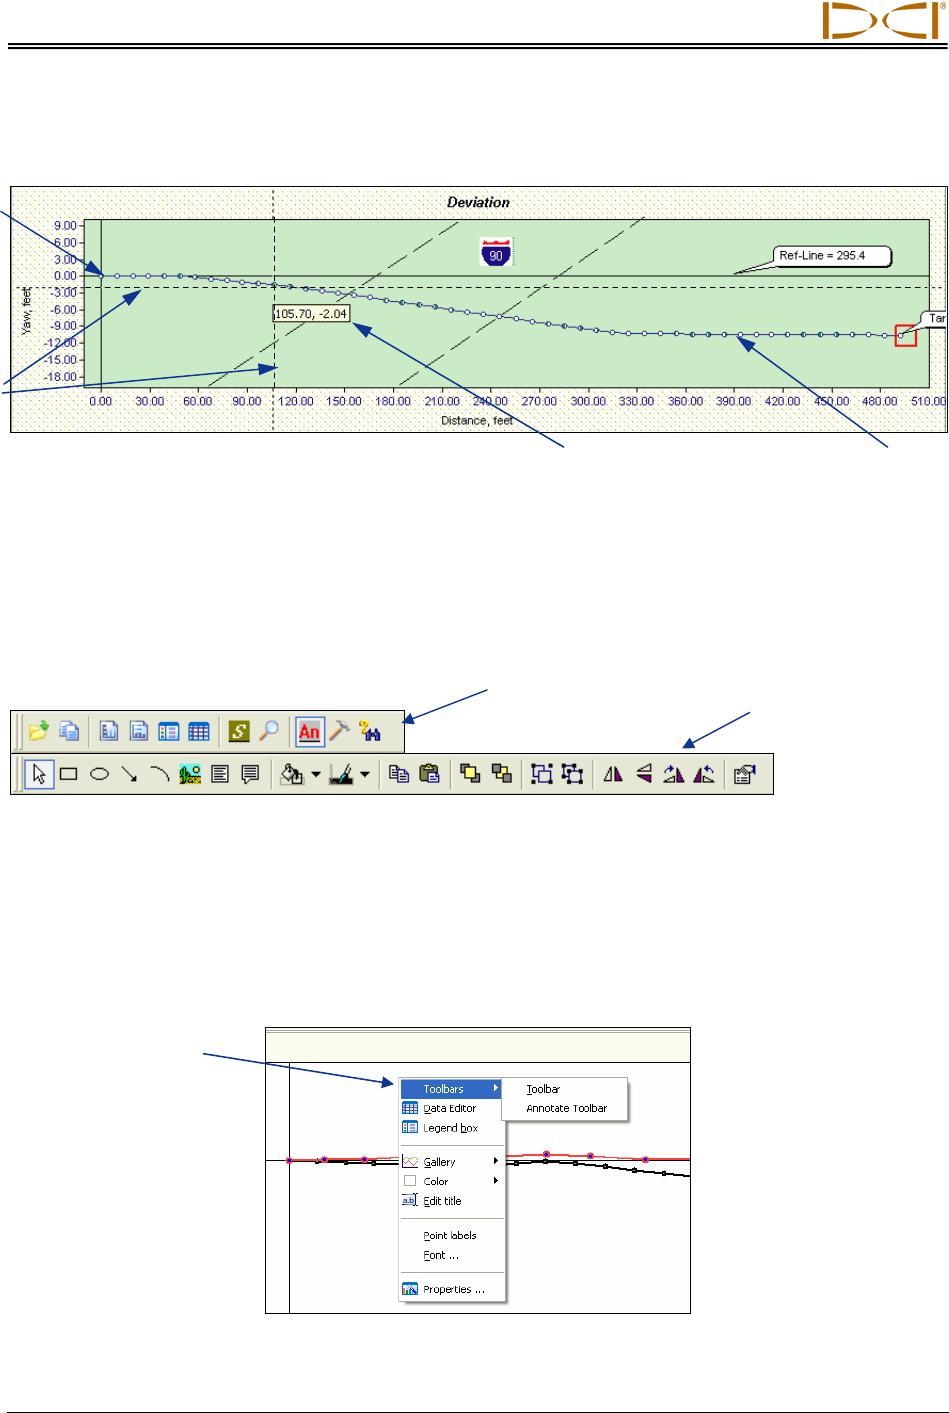
Plot Area Toolbars
Standard
Toolbar
Annotate
Toolbar
When you open the SST software, you should see two rows of icons above both the Profile and Deviation
plot areas. The upper row is the standard toolbar, and the lower row is the annotate toolbar. The standard
toolbar allows you to do a variety of functions with the drilling data, and the annotate toolbar primarily
provides drawing and formatting tools to customize the appearance of the information in the plot area.
Access Toolbars – If you do not see the toolbars, place the cursor in either the Profile or Deviation plot
area and right click to view a popup menu (as shown in the graphic below). Click on the Toolbars option,
then click either Toolbar or Annotate Toolbar to display that toolbar above the plot area.
Popup
Menu
38 Eclipse
®
SST
®
Operator’s Manual