
User Manual

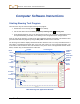
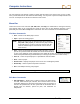
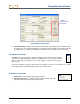
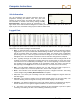
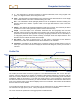
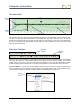
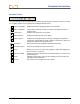
Table Of Contents
- Operator’s Manual
- Digital
- Control
- Incorporated
- Safety Precautions and Warnings
- Introduction
- System Components
- Startup and Operating Instructions
- SST Operating Procedure
- Setting Up SST Laptop
- Setting Up Equipment and Site
- 2. Establish Borepath Reference Line and Mark Borepath
- 3. Assemble and Torque-up Non-Magnetic Housing to Non-Mag Tool
- 4. Align Drill to Marked Borepath
- 5. Position & Align Non-mag Tooling Assembly onto Marked Borepath
- 6. Stage SST Equipment and Power Sources Adjacent to Tooling Assembly
- 7. Power Up Eclipse SST Equipment
- 8. Measure SST Transmitter Current Draw
- 9. Install SST Transmitter into Aligned Non-mag Tooling Assembly
- Setting Reference Heading (Ref Yaw) and Roll Offset
- Calibrating SST Tool and Confirming Proper System Operation
- Logging Drill Run
- Summary of Basic Operating Procedure
- SST Operating Procedure
- Computer Software Instructions
- Inputting and Changing Drill Data
- APPENDIXImporting Topography, Drill Plan, and Planned Deviation from Excel File
- LIMITED WARRANTY

Computer Instructions
T – The temperature of the SST transmitter in degrees Fahrenheit, when using English units
(feet), or in degrees Celsius, when using metric units.
xDist – The transmitter’s horizontal distance from the launch point. Note that this is not the length
of the actual borehole. This value is measured along the x-axis.
Dev – The transmitter’s lateral (left/right) distance from the borepath’s reference heading, dis-
played in either feet or meters. A positive value is to the right and below the x-axis in the Devi-
ation plot.
zDepth – The depth of the transmitter displayed in either feet or meters. This value may be above
or below the x-axis or drill rig elevation (which is the zero elevation line).
tDepth – The total depth of the transmitter measured from the topography that has been
manually entered using the Data Editor (see Inputting and Changing Drill Data section) or im-
ported from an Excel file (see Appendix: Importing Topography Drill Plan and Tool Deviation). If
no topography data has been entered manually, the tDepth will be the depth below the zero
elevation line, and it will be the same as the zDepth.
Roll Offset – The value (in degrees from 0 to 360) used to compensate for the difference
between the tool bit’s roll orientation and the SST transmitter’s roll orientation.
Comments – Information can be added in the Comments column by double-clicking on the row
where you want to add a comment to display the Rod Record dialog box, where you can enter a
comment .
Profile Plot
Ground Surface
Start of
Bore
OnBa
r
lines
Borepath
Cursor Coordinates
The Profile plot area shows the bore’s progress in a two-dimensional Profile view. As the bore pro-
gresses, and more data points are logged, an automatic scaling feature formats the plot area so that the
entire bore remains viewable and does not go “off the chart” (see Chart Autoscaling under “Edit Menu
Commands” earlier in this section). If you place the mouse pointer or cursor anywhere in the plot area
and then hold down the left mouse button, you will see dashed vertical and horizontal lines that intersect
at the cursor location and a pop-up box that displays the cursor coordinates. This location and the dashed
lines are referred to as the OnBar.
In the Profile plot shown above, the cursor location is at the intersection of the two
dashed OnBar lines.
The numbers in the pop-up box (105.41, -28.97) correspond to the cursor coordinates.
The cursor can also be positioned on the logged points for additional data.
Eclipse
®
SST
®
Operator’s Manual 37