
User's Manual

Editing Data
50 Eclipse
®
TensiTrak
®
Operator’s Manual
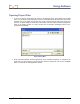
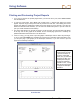
Formatting Force and Pressure Graphs
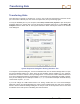
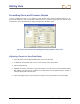
You can customize the look of your graphs by using the 2D Chart Control Properties dialog box. To
access this dialog box, place your mouse in either the force or pressure graph area and click the right
mouse button. The most useful tips for sizing the graphs are described below.
2D Chart Control Properties Dialog Box Showing X-Axis Scale Tab
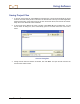
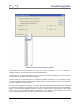
Adjusting Graphs to View Data Better
1. In the 2D Chart Control Properties dialog box, click on the Axes tab.
2. To adjust the X-axis scale, click on the X in the Axes box in the top left area.
3. Click on the Scale tab.
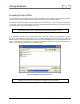
4. Highlight the value in the Max box (as shown above in the 2D Chart Control Properties Dialog
Box graphic), and then type in a number for the data points; we recommend that you choose a
value just beyond the end of the bore.
5. Click on the Apply button, and you will see the scale for the X-axis adjust in the chosen graph.