
User's Manual
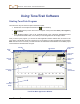

Using Software
Eclipse
®
TensiTrak
®
Operator’s Manual 39
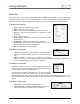
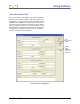
PLOT Button
The PLOT button is used to replot the data in the Pull Force and Mud Pressure
graphs if you have added a value to the Design Load field after the data has
been transferred from the receiver to the computer.
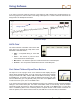
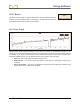
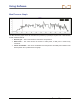
Pull Force Graph
The Pull Force graph shows the amount of pull force (in pounds or kilo-Newtons) exerted on the
TensiTrak unit at each data collection interval (3 seconds) from the moment you began saving data on
the receiver. If you want to see whether the force exerted stayed below or went above a certain value
during the pullback process, you can apply a limit line on the graph to view the results.
¾ Force, lb – The Y-axis shows the value for the pull force.
¾ Sample Points – The X-axis shows the number of data points; a data point is saved every
3 seconds.
¾ Cursor Coordinates – The cursor coordinates show the pull force and data point numbers of the
mouse pointer as it is positioned on the graph.
PLOT