
Instruction manual


28
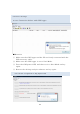
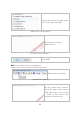
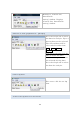
Once the measurement line is set, click OK and the detailed data by lap
will be displayed in the analysis window under the 【 Data】 tab.
<Lap data analysis window>
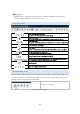
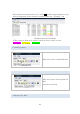
※ The analysis data will indicate the best three times in color.
Best Pink 2
nd
Yellow 3
rd
Green
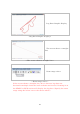
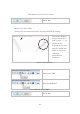
6.5 Load Log Data
This will read a saved GPS data
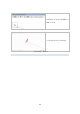
6.6 Load Lap Data
This will read a driving data file
that
has been analyzed.
6.7 Reopen Log Data