
Data Sheet


Datasheet SHT20
www.sensirion.com Version 3 – December 2011 3/14
Users Guide SHT20
1 Extended Specification
For details on how Sensirion is specifying and testing
accuracy performance please consult Application Note
“Statement on Sensor Specification”.
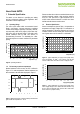
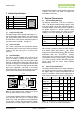
1.1 Operating Range
The sensor works stable within recommended Normal
Range – see Figure 4. Long term exposure to conditions
outside Normal Range, especially at humidity >80%RH,
may temporarily offset the RH signal (+3%RH after 60h).
After return into the Normal Range it will slowly return
towards calibration state by itself. See Section 2.3
“Reconditioning Procedure” for eliminating the offset.
Prolonged exposure to extreme conditions may accelerate
ageing.
Figure 4 Operating Conditions
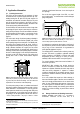
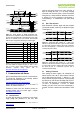
1.2 RH accuracy at various temperatures
Maximal tolerance for RH accuracy at 25°C is defined in
Figure 2. For other temperatures maximal tolerance has
been evaluated to be within limits displayed in Figure 5.
Figure 5 Maximal tolerance of relative humidity measurements
given in %RH for temperatures 0 – 80°C.
Please note that above values are maximal tolerances (not
including hysteresis) against a high precision reference
such as a dew point mirror. Typical deviations are at
±2%RH where maximal tolerance is ±3%RH and about
half the maximal tolerance at other values.
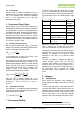
1.3 Electrical Specification
Current consumption as given in Table 1 is dependent on
temperature and supply voltage VDD. For estimations on
energy consumption of the sensor Figures 6 and 7 may be
consulted. Please note that values given in these Figures
are of typical nature and the variance is considerable.
Figure 6 Typical dependency of supply current (sleep mode)
versus temperature at VDD = 3.0V. Please note that the
variance of these data can be above ±25% of displayed value.
Figure 7 Typical dependency of supply current (sleep mode)
versus supply voltage at 25°C. Please note that deviations may
be up to ±50% of displayed value. Values at 60°C scale with a
factor of about 15 (compare Table 1).
0
1
2
3
4
5
6
7
8
0 20 40 60 80 100 120
Supply Current IDD (μA)
Temperature (°C)
6
8
10
12
14
16
18
20
2.1 2.3 2.5 2.7 2.9 3.1 3.3 3.5
Supply Current IDD (nA)
Supply Voltage (VDD)
Relative Humidity (%RH)
100
±7
±7
±7
90
±5
80
±6
±4.5
±6
±8
70
60
50
40
30
20
±7
±7
10
±5
0
±7
0
5
10
15
20
25
30
35
40
45
50
55
60
65
70
75
80
Temperature (°C)
0
20
40
60
80
100
-40 -20 0 20 40 60 80 100 120
Temperature (°C)
Relative Humidity (%)
Max.
Range
Normal
Range