
User`s guide


90 | Dexcom G4 PLATINUM (Pediatric) Continuous Glucose Monitoring System
8
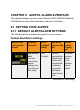
8.2 RATE OF CHANGE ARROWS
Your rate of change arrows add detail about the direction and speed of
glucose change over the last 15-20 minutes.
The trend arrows show to the right of your
current sensor glucose reading.
Do not overreact to the rate of change
arrows. Consider recent insulin dosing, activity,
food intake, your overall trend graph and your
blood glucose value before taking action.
If there are missed communications between
the sensor and receiver during the last 15-20
minutes, an arrow may not display.
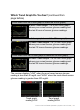
This table shows the different trend arrows your
receiver displays:
Trend Arrows
Constant: Your glucose is steady (not increasing/decreasing more
than 1 mg/dL each minute). Your glucose could increase or decrease
by up to 15 mg/dL in 15 minutes.
Slowly rising: Your glucose is rising 1-2 mg/dL each minute. If it
continued rising at this rate, your glucose could increase up to 30
mg/dL in 15 minutes.
Rising: Your glucose is rising 2-3 mg/dL each minute. If it continued
rising at this rate, your glucose could increase up to 45 mg/dL in
15 minutes.
(continued on next page)
Rate of change arrow
appears in upper right
of trend graph