
User`s guide


Dexcom G4 PLATINUM (Pediatric) System User’s Guide | 89
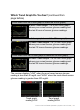
Which Trend Graph Do You See? (continued from
page before)
(Scroll down from the 3-hour graph to reach the 6-hour graph)
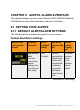
6-Hour Trend Graph: The 6-hour trend graph
shows your current sensor glucose reading and
the last 6 hours of sensor glucose readings.
(Scroll down from the 6-hour graph to reach the 12-hour graph)
12-Hour Trend Graph: The 12-hour trend graph
shows your current sensor glucose reading and
the last 12 hours of sensor glucose readings.
(Scroll down from the 12-hour graph to reach the 24-hour graph)
24-Hour Trend Graph: The 24-hour trend graph
shows your current sensor glucose reading and
the last 24 hours of sensor glucose readings.
The receiver displays “LOW” when the most recent sensor glucose
reading is less than 40 mg/dL and “HIGH” when the most recent sensor
glucose reading is greater than 400 mg/dL.
Trend graph
reading HIGH
Trend graph
reading LOW