
User`s guide


88 | Dexcom G4 PLATINUM (Pediatric) Continuous Glucose Monitoring System
8
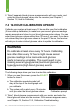
• The dots on your trend graph change colors based on your high and
low alert settings.
You can view your past glucose information on the 1, 3, 6, 12, and 24
hour trend graphs by pressing the UP or DOWN button.
• Your system only reports glucose information between 40-400
mg/dL.Yourtrendgraphshowsaatlineordotsat400or40mg/dL
when your glucose is outside this range.
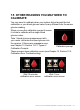
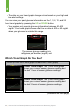
Which Trend Graph Do You See?
(Scroll up from the 3-hour graph to reach the 1-hour graph)
1-Hour Trend Graph: The 1-hour trend graph
shows your current sensor glucose reading and
the last 1 hour of sensor glucose readings.
3-Hour Trend Graph: The 3-hour trend graph
shows your current sensor glucose reading and
the last 3 hours of sensor glucose readings.
(continued on next page)
The sensor glucose reading is in
milligrams per deciliter (mg/dL) unit