
User`s guide


Dexcom G4 PLATINUM (Pediatric) System User’s Guide | 87
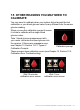
• Each “dot” on the trend graph is a sensor glucose reading reported
every 5 minutes.
• The trend graph shows the current time.
• The status area shows needed calibration updates, calibration errors
and sensor glucose reading issues.
• Your high alert setting shows as a yellow line across the trend graph.
• Your low alert setting shows as a red line across the trend graph.
• The gray zone highlights your target glucose range, based on your
high and low glucose alert settings.
• Your current sensor glucose reading is red if it is low and yellow if it
is high, based on your high and low glucose alert settings.
• If your low glucose alert is not set and your glucose is 55 mg/dL or
lower, your glucose value is red.
• If your sensor glucose readings are in between your high and low
glucose alert settings, the glucose value is white.
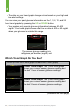
EXAMPLE: 3-Hour Trend Graph Screen
Status area
High glucose
alert setting
Low glucose
alert setting
Antenna
Battery
Most recent 5-minute
sensor glucose reading
Glucose
target
range
Plot of most
recent sensor
glucose readings
Current time
Trend arrow
Trend graph hours
Glucose
values