
User`s guide


Dexcom G4 User’s Guide | 59
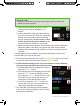
You can view your past glucose information
through the 1, 3, 6, 12, and 24 hour trend graphs
by pressing the UP or DOWN button.
• Your system only reports glucose information
between 2.2-22.2 mmol/L. Your trend graph will
show a at line or dots at 22.2 or 2.2 mmol/L
when your glucose is outside this range.
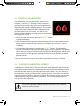
The sensor glucose reading is in
millimoles per liter (mmol/L) unit
(Scroll up from the 3-hour graph to reach the 1-hour graph)
1-Hour Trend Graph: The 1-hour trend graph shows your
current glucose reading and the last 1 hour of sensor glucose
readings.
3-Hour Trend Graph: The 3-hour trend graph shows your
current glucose reading and the last 3 hours of sensor glucose
readings.
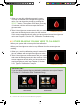
(Scroll down from the 3-hour graph to reach the 6-hour graph)
6-Hour Trend Graph: The 6-hour trend graph shows your
current glucose reading and the last 6 hours of sensor glucose
readings.
(Scroll down from the 6-hour graph to reach the 12-hour graph)
12-Hour Trend Graph: The 12-hour trend graph shows
your current glucose reading and the last 12 hours of sensor
glucose readings.