
User`s guide


58 | Dexcom G4 Continuous Glucose Monitoring System
5
5.1 Sensor Glucose Readings
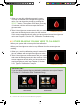
Press the select button to wake up the receiver screen. You will see the home
screen, which is the 3-hour trend graph. The 3-hour trend graph will show the
following:
• Each “dot” on the trend graph is a sensor glucose reading reported every 5
minutes.
• The trend graph shows the current time.
• The display light is activated with a press of any button.
• The status area shows needed calibration updates, calibration errors and
sensor glucose reading issues.
• Your high alert setting will be displayed as a yellow line across the trend graph.
• Your low alert will be displayed as a red line across the trend graph.
• The gray zone highlights your target glucose range based on your
individualized settings for high and low glucose alerts.
• Your current glucose reading will be red if it is low and yellow if it is high, based
on your high and low glucose alert settings.
• The dots on your trend graph will also change colors based on your high and
low alert settings.
• If your low glucose alert is not set and your glucose is 3.1 mmol/L or lower,
your glucose value will be red.
• If your sensor glucose readings are in between your high and low glucose alert
settings, the glucose value will be white.
High glucose
alert setting
Low glucose
alert setting
Antenna
Battery status
Most recent 5-minute
glucose reading
Glucose
target range
Glucose
value
Current time
Status area
Trend arrow