
User`s guide


Dexcom G4 User’s Guide | 137
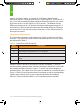
Table 9. Percentage of CGM System Reading within Paired SMBG Results
SMBG Glucose
Ranges mg/dL
(mmol/L)
Number
of Paired
SMBG-CGM
Readings
Percent
within 20%
of SMBG*
Percent
within
30% of
SMBG*
Percent
greater than
40% of SMBG*
40-400 (2.2-22.2) 2824 83% 95% 2%
*40-60 (2.2-3.3) 64 91% 97% 2%
*61-80 (3.4-4.4) 249 81% 95% 3%
81-180 (4.5-10.0) 1726 83% 94% 2%
181-300 (10.1-16.7) 727 85% 96% 1%
301-350 (16.8-19.4) 42 93% 100% 0%
351-400 (19.5-22.2 16 94% 100% 0%
*For SMBG less than 80 mg/dL (4.4 mmol/L), the absolute difference is presented as the
difference between the System and SMBG, rather than the percent.
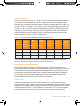
Table 10. System and SMBG Glucose Accuracy
SMBG Glucose
Ranges mg/dL
(mmol/L)
Number
of Paired
System-SMBG
Mean
Percent
Difference
(%)
Median
Percent
Difference
(%)
Mean
Absolute
Percent
Difference
(%)
Median
Absolute
Percent
Difference
(%)
40-400 (2.2-22.2) 2824 1.7 1.9 12.6 9.9
*40-60 (2.2-3.3) 64 8.3 (0.5) 8.5 (0.5) 11. 8 (0.7) 9.5 (0.5)
*61-80 (3.4-4.4) 249 7.0 (0.4) 7.0 (0. 4) 13 .1 (0.7) 10.0 (0.6)
81-180 (4.5-10.0) 1726 2.4 3.1 12.1 9.8
181-300 (10.1-16.7) 727 -3.2 -2.6 11.0 8.8
301-350 (16.8-19.4) 42 -7.6 -5.9 9.3 6.8
351-400 (19.5-22.2) 16 -7. 2 -5.4 7.8 5.4
*For SMBG less than 80 mg/dL (4.4 mmol/L), the differences in mg/dL (mmol/L) are
included instead of percent differences (%).