
User`s guide


Dexcom G4 User’s Guide | 131
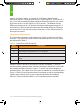
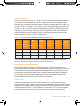
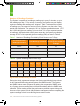
Table 2. System and YSI Glucose Accuracy
YSI Glucose Ranges
mg/dL (mmol/L)
Number
of Paired
System-YSI
Mean
Percent
Difference
(%)
Median
Percent
Difference
(%)
Mean
Absolute
Percent
Difference
(%)
Median
Absolute
Percent
Difference
(%)
40-400 (2.2-22.2) 1477 8.2 8.7 14.1 12.0
*40-60 (2.2-3.3) 25 13.2 (0.7) 12.7 (0.7) 14.6 (0.8) 12.7 (0.7)
*61-80 (3.4-4.4) 146 12.4 (0.7) 13.0 (0.7) 15.8 (0.9) 14.4 (0.8)
81-180 (4.5-10.0) 1019 7. 3 8.2 13.4 11.4
181-300 (10.1-16.7) 283 5.5 7.3 11.5 10.4
301-400 (16.8-22.2) 4 -0.3 -0.4 2.4 2.5
*For YSI less than 80 mg/dL (4.4 mmol/L), the differences in mg/dL (mmol/L) are included
instead of percent differences (%).
In the example above the System reading is less than the YSI value, so the
percent difference reading is negative. The mean percent difference is the
average of all positive and negative percent differences between the two
devices; it tells you if the System reads higher or lower on average than the YSI
at each glucose range.
Another estimate used to show the accuracy of the System is the absolute
percent difference. The absolute percent difference tells you the percent
difference or “distance” between the System and YSI values, but does not tell
you whether the System is reading, on average, higher or lower than the YSI
laboratory standard. The mean absolute percent difference is the average
“distance” (regardless if positive or negative) between System readings and YSI
values.
These accuracy measures are summarized in Table 2 and are based on 1477
paired glucose results.
Table 2 shows that the System, on average, reads 13.2 mg/dL (0.7 mmol/L)
higher than the YSI at glucose levels of 40-60 mg/dL (2.2-3.3 mmol/L) and
reads 12.4 mg/dL (0.7 mmol/L) higher than YSI at glucose level of 61-80
mg/dL (Mean Difference, i.e. 3.4-4.4 mmol/L), and, 5.5% higher than the YSI
at glucose values of 181-300 mg/dL (Mean Percent Difference, i.e. 10.1-16.7
mmol/L).