
User`s guide


Dexcom G4 PLATINUM Professional System User’s Guide | 201
orgreaterthan40mg/dL(2.2mmol/L)or40%werethencalculated.
For example, if the CGM reads 100 mg/dL, it is between 81-180 mg/dL
(4.5-10.0 mmol/L) range, you can expect the CGM readings to be within
20%oftheSMBGvalues78%time.
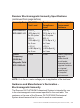
Table 12. System Difference to SMBG within CGM
Glucose Ranges
CGM Glucose
Ranges mg/dL
(mmol/L)
Number
of Paired
CGM-SMBG
Mean
Percent
Difference
(%)
Median
Percent
Difference
(%)
Mean
Absolute
Percent
Difference
(%)
Median
Absolute
Percent
Difference
(%)
Overall
7508 -0.4 -1.4 14.0 11.0
*40-60
(2.2-3.3)
731
-9.3
(-0.5)
-8.0
(-0.4)
11.7
(0.7)
8.0
(0.4)
*61-80
(3.4-4.4)
968
-1.0
(- 0.1)
1.0
(0.1)
10.7
(0.6)
8.0
(0.4)
81-180
(4.5-10.0)
3141 1.4 0.0 14.2 11.0
181-300
(10.1-16.7)
1960 -0.7 -2.8 13.0 10.3
301-350
(16.7-19.4)
450 -0.7 -2.6 10.5 8.6
351-400
(19.4-22.2)
258 5.0 3.0 11.9 8.6
*ForCGM≤80mg/dL(4.4mmol/L),thedifferencesinmg/dL(mmol/L)
areincludedinsteadofpercentdifferences(%).
NOTE: CGM readings are within 40 to 400 mg/dL (2.2-22.2 mmol/L),
inclusive.
Overall,theSystemreads,onaverage,0.4%lower(MeanPercent
Difference)thanSMBGvaluesand14.0%absolutedifferent(Mean
Absolute Percent Difference) than the SMBG values. The Median