
User's Manual


99
the
Advanced
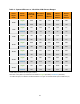
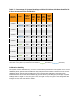
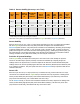
System provided an average of 98% of all expected glucose readings (288) as seen in Table
10.
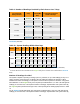
Table 11. CGM System Agreement to SMBG within CGM Glucose Ranges
CGM
Glucose
Ranges
1
(mg/dL)
Study
2
Number of
paired
CGM-SMBG
Percent
within
15/15%
SMBG
Percent
within
20/20%
SMBG
Percent
within
30/30%
SMBG
Percent
greater
than
40/40%
SMBG
Overall
Original 7508 69% 81% 94% 2%
Advanced 2992 77% 87% 96% 1%
40-60
Original 731 75% 84% 92% 4%
Advanced 221 73% 80% 87% 7%
61-80
Original 968 78% 86% 95% 1%
Advanced 336 77% 85% 95% 1%
81-180
Original 3141 65% 78% 93% 2%
Advanced 1362 74% 85% 96% 1%
181-300
Original 1960 68% 81% 94% 3%
Advanced 826 80% 90% 97% 1%
301-350
Original 450 77% 88% 98% 1%
Advanced 161 83% 93% 99% 0%
351-400
Original 258 75% 85% 95% 2%
Advanced 86 90% 93% 98% 1%
1
CGM readings are within 40 to 400 mg/dL, inclusive.
2
Both sets of study data are presented and are labeled as
Original
(SW10050) or
Advanced
(SW10505).
Agreement and Accuracy Relative to SMBG
During the study, agreement between the System and blood glucose values is also characterized using
paired System and SMBG results. The System and SMBG values were compared by pairing the
comparative SMBG value to a System glucose reading that occurred immediately after the SMBG was
collected. These results characterize the performance subjects expect during real-time use of the System in
their daily diabetes management when comparing the System readings to their home blood glucose meter
results.
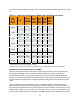
Table 11 is categorized within CGM glucose ranges. For readings less than or equal to 80 mg/dL the
absolute difference in mg/dL between the two glucose results was calculated. For values greater than 80
mg/dL the absolute percent difference (%) from the SMBG values was calculated. The percentages of total
readings within 15 mg/dL or 15%, 20 mg/dL or 20%, 30 mg/dL or 30%, 40 mg/dL or 40% or greater than 40
mg/dL or 40% were then calculated. For example, if the CGM reads 100 mg/dL, it is between 81-180 mg/dL