
User's Manual


98
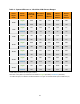
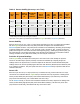
Table 9. Number of Readings Provided by Each Sensor Over 7-Days
% of Total Possible
Readings Provided
Study
1
Total Readings
Provided (Min-
Max)
% of Systems Providing that
Number of Readings
0-25%
Original
167-491
2%
Advanced 0 0%
26-50%
Original
719-914
4%
Advanced
856-856 2%
51-75%
Original
1267-1267
1%
Advanced
1253-1253 2%
76-100%
Original
1811-1992
94%
Advanced
1497-1992 96%
1
BOTH SETS OF STUDY DATA ARE PRESENTED AND ARE LABELED AS
ORIGINAL
(SW10050) OR
ADVANCED
(SW10505).
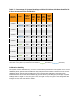
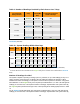
Table 10. System Readings Within Wear Days
Statistic Study
1
Day 1 Day 2 Day 3 Day 4 Day 5 Day 6 Day 7
All
Days
2
Mean
Original 98% 98% 98% 98% 97% 99% 95% 97%
Advanced 98% 99% 98% 98% 96% 99% 97% 98%
Median
Original 100% 100% 100% 100% 100% 100% 100% 100%
Advanced 99% 100% 100% 100% 100% 100% 100% 100%
STD
Original 5% 3% 9% 8% 10% 3% 11% 8%
Advanced 3% 2% 8% 11% 15% 2% 13% 9%
1
Both sets of study data are presented and are labeled as
Original
(SW10050) or
Advanced
(SW10505).
2
A total of 108 sensors were included with the
Original
Study and 51 sensors were included with the
Advanced
Study.
Number of Readings Provided
The System is capable of providing a reading up to every 5 minutes, or up to 288 readings per day. For a
variety of reasons, the System may not display a glucose reading and readings are “skipped.” Table 9
estimates the number of readings you can expect to receive from the System over the entire 7-day period
after calibration. For the
Original
Study, 94% of Systems provided between 1,811 and 1,992 valid glucose
readings (or more than 75% of the expected number of readings). Adjusted within each system wear-day,
the
Original
System provided an average of 97% of all expected glucose readings (288) as seen in Table
10.
For the
Advanced
Study (SW10505), 96% of Systems provided between 1,497 and 1,992 valid glucose
readings (or more than 75% of the expected number of readings). Adjusted within each system wear-day,