
User's Manual


46
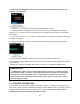
1-Hour Trend Graph: The 1-hour trend graph shows your current sensor
glucose reading and the last 1 hour of sensor glucose readings.
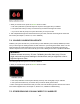
3-Hour Trend Graph: The 3-hour trend graph shows your current sensor
glucose reading and the last 3 hours of sensor glucose readings.
(Scroll down from the 3-hour graph to reach the 6-hour graph)
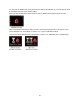
6-Hour Trend Graph: The 6-hour trend graph shows your current sensor
glucose reading and the last 6 hours of sensor glucose readings.
(Scroll down from the 6-hour graph to reach the 12-hour graph)
12-Hour Trend Graph: The 12-hour trend graph shows your current sensor
glucose reading and the last 12 hours of sensor glucose readings.
(Scroll down from the 12-hour graph to reach the 24-hour graph)
24-Hour Trend Graph: The 24-hour trend graph shows your current sensor
glucose reading and the last 24 hours of sensor glucose readings.
The receiver displays “LOW” when the most recent sensor glucose reading is less than 40 mg/dL and
“HIGH” when the most recent sensor glucose reading is greater than 400 mg/dL.