
User's Manual


100
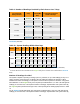
range and you can expect the CGM readings to be within 20% of the SMBG values 78% of the time for the
Original
System and 85% time for the
Advanced
System.
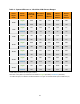
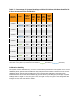
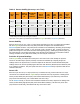
Table 12. CGM System Difference to SMBG within CGM Glucose Ranges
CGM Glucose Ranges
1
(mg/dL)
Study
2
Number of Paired
CGM-SMBG
Mean Percent
Difference
Median
Percent
Difference
Mean Absolute
Percent
Difference
Median
Absolute
Percent
Difference
Overall
Original 7508 -0.4% -1.4% 14.0% 11.0%
Advanced 2992
-2.6% -2.7% 11.3% 8.6%
*40-60
Original 731
-9.3 -8.0 11.7 8.0
Advanced 221
-10.3 -6.0 13.0 8.0
*61-80
Original 968 -1.0 1.0 10.7 8.0
Advanced 336
-4.0 -2.0 10.1 7.0
81-180
Original 3141 1.4% 0.0% 14.2% 11.0%
Advanced 1362 -2.6% -3.1% 11.4% 8.9%
181-300
Original 1960 -0.7% -2.8% 13.0% 10.3%
Advanced 826 -1.4% -2.0% 9.5% 7.4%
301-350
Original 450 -0.7% -2.6% 10.5% 8.6%
Advanced 161 -0.0% 0.0% 8.3% 6.0%
351-400
Original 258 5.0% 3.0% 11.9% 8.6%
Advanced 86 3.9% 3.2% 8.1% 6.7%
1
CGM readings are within 40 to 400 mg/dL, inclusive.
2
Both sets of study data are presented and are labeled as
Original
(SW10050) or
Advanced
(SW10505).
* For CGM ≤ 80 mg/dL, the differences in mg/dL are included instead of percent differences (%).
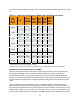
Table 12 is categorized within CGM glucose ranges. Overall, the System in the Original Study reads, on
average, 0.4% lower (Mean Percent Difference) than SMBG values and 14.0% absolute different (Mean
Absolute Percent Difference) than the SMBG values. The Median Percent Difference shows that half of the
time the System reads -1.4% or less than the SMBG values and the Median Absolute Percent Difference
shows that half of the time the System reads about 11.0% or less different than SMBG values.