
User's Manual


60 | Continuous Glucose Monitoring System
5
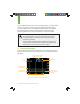
(Scroll up from the 3-Hour Graph to reach the 1-Hour Graph)
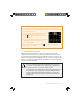
1-Hour Trend Graph: The 1-Hour (1 Hr) Trend Graph shows
your current glucose reading and the last 1 hour of glucose
readings.
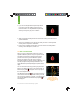
3-Hour Trend Graph: The 3-Hour (3 Hr) Trend Graph shows
your current glucose reading and the last 3 hours of glucose
readings (this is your default Trend Graph screen).
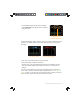
(Scroll down from the 3-Hour Graph to reach the 6-Hour Graph)
6-Hour Trend Graph: The 6-Hour (6 Hr) Trend Graph shows
your current glucose reading and the last 6 hours of glucose
readings.
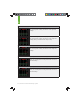
(Scroll down from the 6-Hour Graph to reach the 12-Hour Graph)
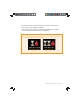
12-Hour Trend Graph: The 12-Hour (12 Hr) Trend Graph
shows your current glucose reading and the last 12 hours of
glucose readings.
(Scroll down from the 12-Hour Graph to reach the 24-Hour Graph)
24-Hour Trend Graph: The 24-Hour (24 Hr) Trend Graph
shows your current glucose reading and the last 24 hours of
glucose readings.