
User's Manual


G4-Global System User’s Guide | 59
•
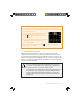
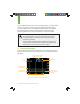
The G4-Global System reports glucose readings
from 40-400 mg/dL and updates glucose readings
every 5 minutes.
The Receiver displays “LOW” when the most recent glucose reading is less than
40 mg/dL, and “HIGH” when the most recent glucose reading is greater than
400 mg/dL.
•
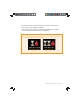
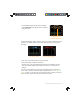
Each “dot” on the Trend Graph is a glucose reading.
•
Every Trend Graph shows the current time.
•
The gray zone on the Trend Graphs indicates the area in between the High
Alert and Low Alert settings (see Chapter 2, Section 2.5 to change these
settings).
You can see Trend Graphs of your glucose information from the past 1-hour,
3-hour, 6-hour, 12-hour, and 24-hour periods by pressing the
TOP or BOTTOM
TOGGLE
button on your Receiver. Trend Graphs show you where your glucose
levels have been and where your glucose levels are headed.
The glucose reading
is in milligrams per
deciliter (mg/dL) units.
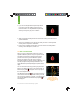
“Low”
Less than 40 mg/dL
“High”
Greater than 400 mg/dL