
User's Manual

136 | Continuous Glucose Monitoring System
YYY
YSI Reading
•••
G4-Global Receiver Glucose Reading
YYY
YSI Reading
•••
G4-Global Receiver Glucose Reading
11
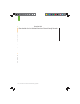
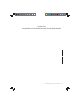
Figure 1.
Clarke Error Grid, G4-Global Receiver Results Compared to YSI Results
Point Error Grid Regions for All Site
The percentage of G4-Global Receiver results in the above graph are presented in
Table 6 on the next page according to the percentage of points falling within each zone
(A-E). Results are further broken down (stratifi ed) according to the range of glucose
concentration.
Section 11.1
Placeholder for G4-Global Receiver Pivotal Study Results