
Concept Guide
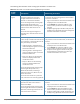


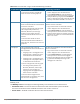


Table Of Contents
- About this Guide
- About Instant
- Setting up a W-IAP
- Automatic Retrieval of Configuration
- Instant User Interface
- Initial Configuration Tasks
- Customizing W-IAP Settings
- Modifying the W-IAP Host Name
- Configuring Zone Settings on a W-IAP
- Specifying a Method for Obtaining IP Address
- Configuring External Antenna
- Configuring Radio Profiles for a W-IAP
- Configuring Uplink VLAN for a W-IAP
- Changing the W-IAP Installation Mode
- Changing USB Port Status
- Master Election and Virtual Controller
- Adding a W-IAP to the Network
- Removing a W-IAP from the Network
- VLAN Configuration
- IPv6 Support
- Wireless Network Profiles
- Configuring Wireless Network Profiles
- Configuring Fast Roaming for Wireless Clients
- Configuring Modulation Rates on a WLAN SSID
- Multi-User-MIMO
- Management Frame Protection
- Disabling Short Preamble for Wireless Client
- Editing Status of a WLAN SSID Profile
- Editing a WLAN SSID Profile
- Deleting a WLAN SSID Profile
- Wired Profiles
- Captive Portal for Guest Access
- Understanding Captive Portal
- Configuring a WLAN SSID for Guest Access
- Configuring Wired Profile for Guest Access
- Configuring Internal Captive Portal for Guest Network
- Configuring External Captive Portal for a Guest Network
- Configuring Facebook Login
- Configuring Guest Logon Role and Access Rules for Guest Users
- Configuring Captive Portal Roles for an SSID
- Configuring Walled Garden Access
- Authentication and User Management
- Managing W-IAP Users
- Supported Authentication Methods
- Supported EAP Authentication Frameworks
- Configuring Authentication Servers
- Understanding Encryption Types
- Configuring Authentication Survivability
- Configuring 802.1X Authentication for a Network Profile
- Enabling 802.1X Supplicant Support
- Configuring MAC Authentication for a Network Profile
- Configuring MAC Authentication with 802.1X Authentication
- Configuring MAC Authentication with Captive Portal Authentication
- Configuring WISPr Authentication
- Blacklisting Clients
- Uploading Certificates
- Roles and Policies
- DHCP Configuration
- Configuring Time-Based Services
- Dynamic DNS Registration
- VPN Configuration
- IAP-VPN Deployment
- Adaptive Radio Management
- Deep Packet Inspection and Application Visibility
- Voice and Video
- Services
- Configuring AirGroup
- Configuring a W-IAP for RTLS Support
- Configuring a W-IAP for Analytics and Location Engine Support
- Managing BLE Beacons
- Clarity Live
- Configuring OpenDNS Credentials
- Integrating a W-IAP with Palo Alto Networks Firewall
- Integrating a W-IAP with an XML API Interface
- CALEA Integration and Lawful Intercept Compliance
- Cluster Security
- W-IAP Management and Monitoring
- Uplink Configuration
- Intrusion Detection
- Mesh W-IAP Configuration
- Mobility and Client Management
- Spectrum Monitor
- W-IAP Maintenance
- Monitoring Devices and Logs
- Hotspot Profiles
- ClearPass Guest Setup
- IAP-VPN Deployment Scenarios
- Acronyms and Abbreviations
Graph
Name
Description Monitoring Procedure
To see the exact speed at a particular
time, move the cursor over the graph line.
speed at 12:26 hours is 240 Mbps.
Throughput The Throughput Graph shows the
throughput of the selected client for the
last 15 minutes.
l Outgoing traffic—Throughput for the
outgoing traffic is displayed in green.
It is shown above the median line.
l Incoming traffic—Throughput for the
incoming traffic is displayed in blue. It
is shown below the median line.
To see an enlarged view, click the graph.
The enlarged view shows Last, Minimum,
Maximum, and Average statistics for the
incoming and outgoing traffic throughput
of the client for the last 15 minutes.
To see the exact throughput at a
particular time, move the cursor over the
graph line.
To monitor the errors for the client for the last 15
minutes:
1. Log in to the Instant UI. The Virtual Controller view
is displayed. This is the default view.
2. In the Clients tab, click the IP address of the client
for which you want to monitor the throughput.
3. Study the Throughput graph in the RF Trends
pane. For example, the graph shows 1.0 Kbps
outgoing traffic throughput for the client at 12:30
hours.
Table 12: Client View—RF Trends Graphs and Monitoring Procedures
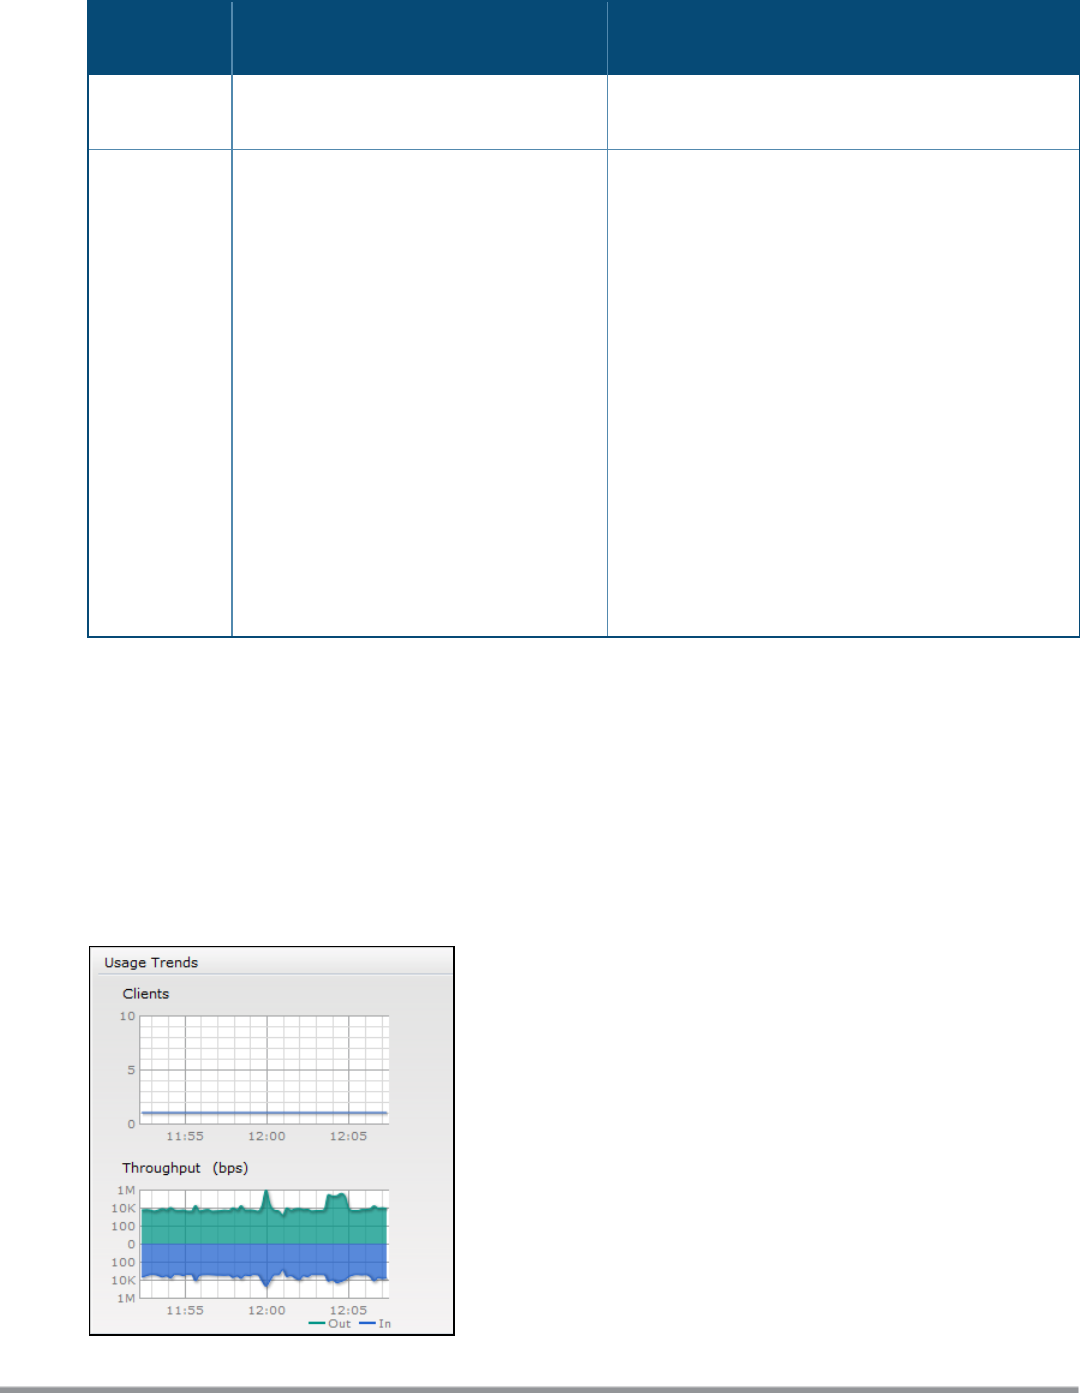
Usage Trends
The Usage Trends section displays the following graphs:
l Clients—In the default view, the Clients graph displays the number of clients that were associated with the
VC in the last 15 minutes. In Network view or the Access Point view, this graph displays the number of
clients that were associated with the selected network or W-IAP in the last 15 minutes.
l Throughput—In the default view, the Throughput graph displays the incoming and outgoing throughput
traffic for the VC in the last 15 minutes. In the Network view or the Access Point view, this graph displays
the incoming and outgoing throughput traffic for the selected network or W-IAP in the last 15 minutes.
Figure 14 Usage Trends Graphs in the Default View
Dell Networking W-Series Instant 6.5.1.0-4.3.1.0 | User Guide Instant User Interface | 44