
Install Guide


29 Best Practices for Sharing an iSCSI SAN Infrastructure with Dell PS Series and SC Series Storage using VMware vSphere
Hosts | 2015-A-BP-INF
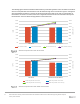
Both VMs started running a vdbench 256K Write workload. Roughly midpoint in the hour-long test, one of the
two iSCSI switches were powered off, simulating a switch failure. The output chart in Figure 7 shows a drop in
IOPS and a spike in latency at the time of the failure, as would be expected. Also, as expected, the latency
quickly recovers to roughly double the latency observed prior to the failure. Additionally, at the time of the
failure, IOPS encounter a momentary drop, but quickly recover to roughly half of the pre-failure IOPS. Overall,
the performance observed during the switch failure is consistent with reducing the paths over which storage
traffic is passed, by half.
High availability test
0
50
100
150
200
250
300
350
0
2,000
4,000
6,000
8,000
10,000
12,000
14,000
16,000
18,000
20,000
1
5
9
13
17
21
25
29
33
37
41
45
49
53
57
61
65
69
73
77
81
85
89
93
97
101
105
109
113
117
Latency (ms)
IOPS
Test points
IOPS Latency