
Install Guide


27 Best Practices for Sharing an iSCSI SAN Infrastructure with Dell PS Series and SC Series Storage using VMware vSphere
Hosts | 2015-A-BP-INF
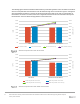
The following figures show the baseline IOPS and latency information gathered on the PS Series environment
and how it compares after the introduction of the SC Series storage to the environment. Figure 4 and Figure 5
show the baseline information on the left and the shared environment data on the right, as a percentage of
the baseline. As shown in the charts, there was no significant decrease in IOPS nor increase in latency with
the introduction of the SC Series storage platform to the environment.
Shared host performance data: 8K and 64K
Shared host performance data: 256K read and write
90%
92%
94%
96%
98%
100%
102%
104%
0%
20%
40%
60%
80%
100%
120%
140%
PS Series PS Series and SC Series
Latency (ms)
IOPS
8K random IOPS 64K random IOPS 8K random latency 64K random latency
90%
92%
94%
96%
98%
100%
102%
104%
0%
20%
40%
60%
80%
100%
120%
140%
PS Series PS Series and SC Series
Latency (ms)
IOPS
256K sequential read IOPS 256K sequential write IOPS
256K sequential read latency 256K sequential write latency