
White Papers


BP1018 Sizing and Best Practices for Citrix XenDesktop with Dell EqualLogic Storage 29
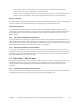
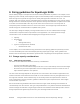
Figure 14 Total IOPS and average latency on VDI Pool
All 1270 desktops were booted within 10 to 12 minutes. The storage arrays were able to handle this
spike in IOPS and the average latency remained below 10 ms through the test. As shown in Figure 14,
the boot storm consisted of both read and write I/O. Read I/O is a smaller proportion compared to the
write I/O due to the disk image streaming from provisioning servers.
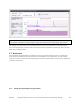
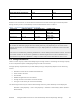
Read I/O is caused by vDisk read by provisioning servers and reads to the desktop write cache during
initialization. Write I/O is primarily caused by write cache initialization during login and steady state
application activity. The following SAN HQ chart shows the amount of read and write IOPS on an
individual write cache volume.