
White Papers

BP1018 Sizing and Best Practices for Citrix XenDesktop with Dell EqualLogic Storage 23
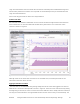
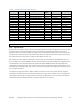
Table 4 Detailed view of total IOPS at disk level
Member Pool Disk Description Average
IOPS
Read I/O rate Write I/O rate
XenVDI-XVS
VDI-Pool
0
SSD 100 GB SATA-II
1335.4
9.5 MB/sec
13.8 MB/sec
XenVDI-XVS
VDI-Pool
1
SSD 100 GB SATA-II
1334.1
11.1 MB/sec
15.4 MB/sec
XenVDI-XVS VDI-Pool 2 SSD 100 GB SATA-II 1391.6 9.7 MB/sec 14.0 MB/sec
XenVDI-XVS
VDI-Pool
3
SSD 100 GB SATA-II
1403.7
11.8 MB/sec
16.0 MB/sec
XenVDI-XVS VDI-Pool 4 SSD 100 GB SATA-II 1726.9 10.3 MB/sec 14.6 MB/sec
XenVDI-XVS
VDI-Pool
5
SSD 100 GB SATA-II
1366.7
10.4 MB/sec
14.8 MB/sec
XenVDI-XVS
VDI-Pool
6
SSD 100 GB SATA-II
1381.5
9.9 MB/sec
14.2 MB/sec
XenVDI-XVS
VDI-Pool
7
SSD 100 GB SATA-II
1380.6
11.4 MB/sec
15.7 MB/sec
XenVDI-XVS VDI-Pool 8 15K 450 GB SAS 1.1 17.0 KB/sec 8.5 KB/sec
XenVDI-XVS
VDI-Pool
9
15K 450 GB SAS
1.2
25.6 KB/sec
8.5 KB/sec
XenVDI-XVS VDI-Pool 10 15K 450 GB SAS 1.1 17.0 KB/sec 8.5 KB/sec
XenVDI-XVS
VDI-Pool
11
15K 450 GB SAS
1.1
26.6 KB/sec
8.5 KB/sec
XenVDI-XVS VDI-Pool 12 15K 450 GB SAS 1.3 17.0 KB/sec 8.5 KB/sec
XenVDI-XVS
VDI-Pool
13
15K 450 GB SAS
<1.0
17.0 KB/sec
0 KB/sec
XenVDI-XVS VDI-Pool 14 15K 450 GB SAS 1.2 25.6 KB/sec 8.5 KB/sec
XenVDI-XVS
VDI-Pool
15
15K 450 GB SAS
0
0 KB/sec
0 KB/sec
Note: The IOPS on disk 15 were zero because it was a hot spare.
5.4.2 Login storm I/O
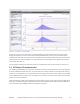
All 630 users were able to login to the virtual desktops within 20 minutes. A significant increase in IOPS
was observed as all the users logged in to the virtual desktop simultaneously. When users login, a
significant amount of read and write I/O happens on the underlying storage from the write cache and
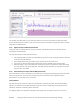
also because of read activity from the vDisk image. We show only the write IOPS in Figure 10 because
the vDisk read I/O was the same in all tests as described in section 5.2.
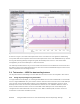
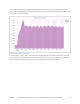
We used the Live View feature of SAN HQ to monitor the real-time IOPS on the PS6010XVS array. As
shown in Figure 10, a peak of 6846 IOPS was observed on the array when all 630 users logged into the
virtual desktops. The write IOPS during the peak were higher (6846 IOPS) than during steady state
(4500 IOPS) as described earlier. This is due the write cache initialization activities caused by the OS on
each desktop during login. After login most of the write activity is due the application activities to serve
the simulated workload.
The login storm typically results in higher IOPS due to factors such as user profile activity, software
initialization, and different services which are started upon login. Also the initial launch of applications
and software services takes a large amount of IOPS and as applications are re-launched, the IOPS are
reduced because the Windows OS has cached the applications in memory.