
Connectivity Guide

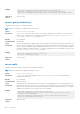

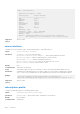

Table Of Contents
- OS10 Enterprise Edition User Guide Release 10.4.3.0
- Getting Started
- Supported Hardware
- Download OS10 image and license
- Installation using ONIE
- Log into OS10
- Install OS10 license
- Zero-touch deployment
- Remote access
- CLI Basics
- CLI command categories
- CONFIGURATION Mode
- Command help
- Check device status
- Candidate configuration
- Change to transaction-based configuration mode
- Copy running configuration
- Restore startup configuration
- Reload system image
- Filter show commands
- Alias command
- Batch mode
- Linux shell commands
- SSH commands
- OS9 environment commands
- Common commands
- alias
- alias (multi-line)
- batch
- boot
- commit
- configure
- copy
- default (alias)
- delete
- description (alias)
- dir
- discard
- do
- feature config-os9-style
- exit
- hostname
- license
- line (alias)
- lock
- management route
- move
- no
- reload
- show alias
- show boot
- show candidate-configuration
- show environment
- show inventory
- show ip management-route
- show ipv6 management-route
- show license status
- show running-configuration
- show startup-configuration
- show system
- show version
- start
- system
- system-cli disable
- system identifier
- terminal
- traceroute
- unlock
- write
- System management
- OS10 upgrade
- System banners
- User session management
- Telnet server
- Simple Network Management Protocol
- System clock
- Network Time Protocol
- Dynamic Host Configuration Protocol
- Interfaces
- Ethernet interfaces
- Unified port groups
- Z9264F-ON port-group profiles
- L2 mode configuration
- L3 mode configuration
- Fibre Channel interfaces
- Management interface
- VLAN interfaces
- User-configured default VLAN
- VLAN scale profile
- Loopback interfaces
- Port-channel interfaces
- Configure interface ranges
- Switch-port profiles
- Configure breakout mode
- Breakout auto-configuration
- Forward error correction
- Energy-efficient Ethernet
- View interface configuration
- Digital optical monitoring
- Interface commands
- channel-group
- default vlan-id
- description (Interface)
- duplex
- enable dom
- enable dom traps
- feature auto-breakout
- fec
- interface breakout
- interface ethernet
- interface loopback
- interface mgmt
- interface null
- interface port-channel
- interface range
- interface vlan
- link-bundle-utilization
- mode
- mode l3
- mtu
- port mode Eth
- port-group
- profile
- scale-profile vlan
- show interface
- show inventory media
- show link-bundle-utilization
- show port-channel summary
- show port-group
- show switch-port-profile
- show system
- show vlan
- shutdown
- speed (Fibre Channel)
- speed (Management)
- switch-port-profile
- switchport access vlan
- switchport mode
- switchport trunk allowed vlan
- Fibre Channel
- Layer 2
- 802.1X
- Far-end failure detection
- Link Aggregation Control Protocol
- Link Layer Discovery Protocol
- Optional TLVs
- Organizationally-specific TLVs
- Media endpoint discovery
- Network connectivity device
- LLDP-MED capabilities TLV
- Network policies TLVs
- Define network policies
- Packet timer values
- Disable and re-enable LLDP
- Disable and re-enable LLDP on management ports
- Advertise TLVs
- Network policy advertisement
- Fast start repeat count
- View LLDP configuration
- Adjacent agent advertisements
- Time to live
- LLDP commands
- clear lldp counters
- clear lldp table
- lldp enable
- lldp holdtime-multiplier
- lldp med fast-start-repeat-count
- lldp med
- lldp med network-policy
- lldp med network-policy (Interface)
- lldp med tlv-select
- lldp port-description-tlv advertise
- lldp receive
- lldp reinit
- lldp timer
- lldp tlv-select basic-tlv
- lldp tlv-select dot1tlv
- lldp tlv-select dot3tlv
- lldp transmit
- show lldp interface
- show lldp errors
- show lldp med
- show lldp neighbors
- show lldp timers
- show lldp tlv-select interface
- show lldp traffic
- show nework-policy profile
- Media Access Control
- Multiple Spanning-Tree
- Configure MSTP
- Create instances
- Root selection
- Non-Dell EMC hardware
- Region name or revision
- Modify parameters
- Interface parameters
- EdgePort Forward traffic
- Spanning-tree extensions
- Recover BPDU guard error disabled ports
- Setting spanning-tree link type for rapid state transitions
- MAC flush optimization
- MST commands
- errdisable detect cause bpduguard
- errdisable recovery cause bpduguard
- errdisable recovery interval
- instance
- name
- revision
- spanning-tree bpdufilter
- spanning-tree bpduguard
- spanning-tree disable
- spanning-tree guard
- spanning-tree link-type
- spanning-tree mac-flush-timer
- spanning-tree mode
- spanning-tree mst
- spanning-tree msti
- spanning-tree mst configuration
- spanning-tree mst disable
- spanning-tree mst force-version
- spanning-tree mst forward-time
- spanning-tree mst hello-time
- spanning-tree mst mac-flush-threshold
- spanning-tree mst max-age
- spanning-tree mst max-hops
- spanning-tree port
- show errdisable
- show spanning-tree mst
- show spanning-tree msti
- Rapid per-VLAN spanning-tree plus
- Load balance and root selection
- Enable RPVST+
- Select root bridge
- Root assignment
- Loop guard
- Global parameters
- Setting spanning-tree link type for rapid state transitions
- MAC flush optimization
- RPVST+ commands
- clear spanning-tree counters
- clear spanning-tree detected-protocol
- show spanning-tree vlan
- spanning-tree bpdufilter
- spanning-tree bpduguard
- spanning-tree disable
- spanning-tree guard
- spanning-tree link-type
- spanning-tree mac-flush-timer
- spanning-tree mode
- spanning-tree port
- spanning-tree vlan cost
- spanning-tree vlan disable
- spanning-tree vlan forward-time
- spanning-tree vlan force-version
- spanning-tree vlan hello-time
- spanning-tree vlan mac-flush-threshold
- spanning-tree vlan max-age
- spanning-tree vlan priority
- spanning-tree vlan priority (Interface)
- spanning-tree vlan root
- Rapid Spanning-Tree Protocol
- Enable globally
- Global parameters
- Interface parameters
- Root bridge selection
- EdgePort forward traffic
- Spanning-tree extensions
- Setting spanning-tree link type for rapid state transitions
- MAC flush optimization
- RSTP commands
- clear spanning-tree counters
- show spanning-tree active
- show spanning-tree interface
- spanning-tree bpdufilter
- spanning-tree bpduguard
- spanning-tree disable
- spanning-tree guard
- spanning-tree link-type
- spanning-tree mac-flush-timer
- spanning-tree mode
- spanning-tree port
- spanning-tree rstp force-version
- spanning-tree rstp forward-time
- spanning-tree rstp hello-time
- spanning-tree rstp mac-flush-threshold
- spanning-tree rstp max-age
- spanning-tree rstp
- Virtual LANs
- Port monitoring
- Layer 3
- Virtual routing and forwarding
- Configure management VRF
- Configure non-default VRF instances
- VRF configuration
- View VRF instance information
- Static route leaking
- VRF commands
- Bidirectional Forwarding Detection
- BFD session states
- BFD three-way handshake
- BFD configuration
- Configure BFD globally
- BFD for BGP
- BFD for OSPF
- BFD for Static route
- Establishing BFD Sessions for IPv4 Static Routes
- Establishing BFD Sessions for IPv4 Static Routes in a non-default VRF instance
- Changing IPv4 Static Route Session Parameters
- Disabling BFD for IPv4 Static Routes
- Establishing BFD Sessions for IPv6 Static Routes
- Establishing BFD Sessions for IPv6 Static Routes in a non-default VRF instance
- Changing IPv6 Static Route Session Parameters
- Disabling BFD for IPv6 Static Routes
- BFD commands
- Border Gateway Protocol
- Sessions and peers
- Route reflectors
- Multiprotocol BGP
- Attributes
- Selection criteria
- Weight and local preference
- Multiexit discriminators
- Origin
- AS path and next-hop
- Best path selection
- More path support
- Advertise cost
- 4-Byte AS numbers
- AS number migration
- Configure Border Gateway Protocol
- Enable BGP
- Configure Dual Stack
- Configure administrative distance
- Peer templates
- Neighbor fall-over
- Configure password
- Fast external fallover
- Passive peering
- Local AS
- AS number limit
- Redistribute routes
- Additional paths
- MED attributes
- Local preference attribute
- Weight attribute
- Enable multipath
- Route-map filters
- Route reflector clusters
- Aggregate routes
- Confederations
- Route dampening
- Timers
- Neighbor soft-reconfiguration
- BGP commands
- activate
- add-path
- address-family
- advertisement-interval
- advertisement-start
- aggregate-address
- allowas-in
- always-compare-med
- as-notation
- bestpath as-path
- bestpath med
- bestpath router-id
- clear ip bgp
- clear ip bgp *
- clear ip bgp dampening
- clear ip bgp flap-statistics
- connection-retry-timer
- confederation
- client-to-client
- cluster-id
- bgp dampening
- description
- default-metric
- default-originate
- distance bgp
- distribute-list
- bgp default local-preference
- ebgp-multihop
- enforce-first-as
- fall-over
- fast-external-fallover
- inherit template
- listen
- local-as
- log-neighbor-changes
- maximum-paths
- maximum-prefix
- neighbor
- next-hop-self
- non-deterministic-med
- outbound-optimization
- password
- redistribute
- remote-as
- remove-private-as
- route-map
- route-reflector-client
- router bgp
- router-id
- send-community
- sender-side-loop-detection
- show ip bgp
- show ip bgp dampened-paths
- show ip bgp flap-statistics
- show ip bgp ipv4 unicast
- show ip bgp ipv6 unicast
- show ip bgp neighbors
- show ip bgp peer-group
- show ip bgp summary
- show ip route
- show ipv6 route
- soft-reconfiguration inbound
- template
- timers
- vrf
- weight
- Equal cost multi-path
- IPv4 routing
- IPv6 routing
- Enable or disable IPv6
- IPv6 addresses
- Stateless autoconfiguration
- Neighbor Discovery
- Duplicate address discovery
- Static IPv6 routing
- IPv6 destination unreachable
- IPv6 hop-by-hop options
- View IPv6 information
- IPv6 commands
- clear ipv6 neighbors
- clear ipv6 route
- ipv6 address
- ipv6 address autoconfig
- ipv6 address dhcp
- ipv6 enable
- ipv6 address eui-64
- ipv6 address link-local
- ipv6 hop-by-hop
- ipv6 nd dad
- ipv6 nd hop-limit
- ipv6 nd managed-config-flag
- ipv6 nd max-ra-interval
- ipv6 nd mtu
- ipv6 nd other-config-flag
- ipv6 nd prefix
- ipv6 nd ra-lifetime
- ipv6 nd reachable-time
- ipv6 nd retrans-timer
- ipv6 nd send-ra
- ipv6 route
- ipv6 unreachables
- show ipv6 neighbors
- show ipv6 route
- show ipv6 interface brief
- Open shortest path first
- Autonomous system areas
- Areas, networks, and neighbors
- Router types
- Designated and backup designated routers
- Link-state advertisements
- Router priority
- Shortest path first throttling
- OSPFv2
- Enable OSPFv2
- Enable OSPFv2 in a non-default VRF instance
- Assign router identifier
- Stub areas
- Passive interfaces
- Fast convergence
- Interface parameters
- Redistribute routes
- Default route
- Summary address
- Graceful restart
- OSPFv2 authentication
- Troubleshoot OSPFv2
- OSPFv2 commands
- area default-cost
- area nssa
- area range
- area stub
- auto-cost reference-bandwidth
- clear ip ospf process
- clear ip ospf statistics
- default-information originate
- default-metric
- fast-converge
- graceful-restart
- ip ospf area
- ip ospf authentication-key
- ip ospf cost
- ip ospf dead-interval
- ip ospf hello-interval
- ip ospf message-digest-key
- ip ospf mtu-ignore
- ip ospf network
- ip ospf passive
- ip ospf priority
- ip ospf retransmit-interval
- ip ospf transmit-delay
- log-adjacency-changes
- max-metric router-lsa
- maximum-paths
- redistribute
- router-id
- router ospf
- show ip ospf
- show ip ospf asbr
- show ip ospf database
- show ip ospf database asbr-summary
- show ip ospf database external
- show ip ospf database network
- show ip ospf database nssa external
- show ip ospf database opaque-area
- show ip ospf database opaque-as
- show ip ospf database opaque-link
- show ip ospf database router
- show ip ospf database summary
- show ip ospf interface
- show ip ospf routes
- show ip ospf statistics
- show ip ospf topology
- summary-address
- timers lsa arrival
- timers spf
- timers throttle lsa all
- OSPFv3
- Enable OSPFv3
- Enable OSPFv3 in a non-default VRF instance
- Assign Router ID
- Configure Stub Areas
- Enable Passive Interfaces
- Interface OSPFv3 Parameters
- Default route
- OSPFv3 IPsec authentication and encryption
- Troubleshoot OSPFv3
- OSPFv3 Commands
- area authentication
- area encryption
- area stub
- auto-cost reference-bandwidth
- clear ipv6 ospf process
- clear ipv6 ospf statistics
- default-information originate
- ipv6 ospf area
- ipv6 ospf authentication
- ipv6 ospf cost
- ipv6 ospf dead-interval
- ipv6 ospf encryption
- ipv6 ospf hello-interval
- ipv6 ospf network
- ipv6 ospf passive
- ipv6 ospf priority
- log-adjacency-changes
- maximum-paths
- redistribute
- router-id
- router ospfv3
- show ipv6 ospf
- show ipv6 ospf database
- show ipv6 ospf interface
- show ipv6 ospf neighbor
- show ipv6 ospf statistics
- timers spf (OSPFv3)
- Object tracking manager
- Policy-based routing
- Virtual Router Redundancy Protocol
- Virtual routing and forwarding
- Multicast
- Important notes
- Configure multicast routing
- Unknown multicast flood control
- Multicast Commands
- Internet Group Management Protocol
- Standards compliance
- Important notes
- Supported IGMP versions
- Query interval
- Last member query interval
- Maximum response time
- IGMP immediate leave
- Select an IGMP version
- View IGMP-enabled interfaces and groups
- IGMP snooping
- IGMP commands
- clear ip igmp groups
- ip igmp immediate-leave
- ip igmp last-member-query-interval
- ip igmp query-interval
- ip igmp query-max-resp-time
- ip igmp snooping enable
- ip igmp snooping
- ip igmp snooping fast-leave
- ip igmp snooping last-member-query-interval
- ip igmp snooping mrouter
- ip igmp snooping querier
- ip igmp snooping query-interval
- ip igmp query-max-resp-time
- ip igmp version
- show ip igmp groups
- show ip igmp interface
- show ip igmp snooping groups
- show ip igmp snooping interface
- show ip igmp snooping mrouter
- Multicast Listener Discovery Protocol
- MLD snooping
- MLD snooping commands
- ipv6 mld snooping
- ipv6 mld snooping enable
- ipv6 mld snooping fast-leave
- ipv6 mld snooping last-member-query-interval
- ipv6 mld snooping mrouter
- ipv6 mld snooping querier
- ipv6 mld snooping query-interval
- ipv6 mld query-max-resp-time
- ipv6 mld version
- show ipv6 mld snooping groups
- show ipv6 mld snooping groups detail
- show ipv6 mld snooping interface
- show ipv6 mld snooping mrouter
- Protocol Independent Multicast
- VXLAN
- VXLAN concepts
- VXLAN as NVO solution
- Configure VXLAN
- L3 VXLAN route scaling
- DHCP relay on VTEPs
- View VXLAN configuration
- VXLAN MAC addresses
- VXLAN commands
- hardware overlay-routing-profile
- interface virtual-network
- ip virtual-router address
- ip virtual-router mac-address
- member-interface
- nve
- remote-vtep
- show hardware overlay-routing-profile mode
- show interface virtual-network
- show nve remote-vtep
- show nve remote-vtep counters
- show nve vxlan-vni
- show virtual-network
- show virtual-network counters
- show virtual-network interface counters
- show virtual-network interface
- show virtual-network vlan
- show vlan (virtual network)
- source-interface loopback
- virtual-network
- virtual-network untagged-vlan
- vxlan-vni
- VXLAN MAC commands
- clear mac address-table dynamic nve remote-vtep
- clear mac address-table dynamic virtual-network
- show mac address-table count extended
- show mac address-table count nve
- show mac address-table count virtual-network
- show mac address-table extended
- show mac address-table nve
- show mac address-table virtual-network
- Example: VXLAN with static VTEP
- BGP EVPN for VXLAN
- Controller-provisioned VXLAN
- UFT modes
- Security
- User re-authentication
- Password strength
- Role-based access control
- Assign user role
- Bootloader Protection
- Linuxadmin User Configuration
- RADIUS authentication
- RADIUS over TLS authentication
- TACACS+ authentication
- Unknown user role
- SSH server
- Virtual terminal line
- Enable AAA accounting
- Enable user lockout
- Limit concurrent login sessions
- Enable login statistics
- Privilege levels overview
- Audit log
- Security commands
- aaa accounting
- aaa authentication login
- aaa re-authenticate enable
- boot protect disable username
- boot protect enable username password
- clear logging audit
- crypto ssh-key generate
- disable
- enable
- enable password
- ip access-class
- ip radius source-interface
- ip tacacs source-interface
- ipv6 access-class
- ip ssh server challenge-response-authentication
- ip ssh server cipher
- ip ssh server enable
- ip ssh server hostbased-authentication
- ip ssh server kex
- ip ssh server mac
- ip ssh server password-authentication
- ip ssh server port
- ip ssh server pubkey-authentication
- ip ssh server vrf
- line vty
- logging audit enable
- login concurrent-session limit
- login-statistics enable
- password-attributes
- password-attributes max-retry lockout-period
- privilege
- radius-server host
- radius-server host tls
- radius-server retransmit
- radius-server timeout
- radius-server vrf
- show boot protect
- show crypto ssh-key
- show ip ssh
- show logging audit
- show login-statistics
- show privilege
- show running-configuration privilege
- show users
- system-user linuxadmin disable
- system-user linuxadmin password
- tacacs-server host
- tacacs-server timeout
- tacacs-server vrf
- username password role
- username sshkey
- username sshkey filename
- userrole inherit
- X.509v3 certificates
- OpenFlow
- OpenFlow logical switch instance
- OpenFlow controller
- OpenFlow version 1.3
- Ports
- Flow table
- Group table
- Meter table
- Instructions
- Action set
- Action types
- Counters
- OpenFlow protocol
- Connection setup TCP
- Supported controllers
- Flow table modification messages
- Message types
- Flow match fields
- Action structures
- Capabilities supported by the data path
- Multipart message types
- Switch description
- Property type
- Group configuration
- Controller roles
- Packet-in reasons
- Flow-removed reasons
- Error types from switch to controller
- OpenFlow use cases
- Configure OpenFlow
- OpenFlow commands
- OpenFlow-only mode commands
- Access Control Lists
- IP ACLs
- MAC ACLs
- Control-plane ACLs
- IP fragment handling
- L3 ACL rules
- Assign sequence number to filter
- Delete ACL rule
- L2 and L3 ACLs
- Assign and apply ACL filters
- Ingress ACL filters
- Egress ACL filters
- Clear access-list counters
- IP prefix-lists
- Route-maps
- Match routes
- Set conditions
- Continue clause
- ACL flow-based monitoring
- Enable flow-based monitoring
- View ACL table utilization report
- ACL logging
- ACL commands
- clear ip access-list counters
- clear ipv6 access-list counters
- clear mac access-list counters
- deny
- deny (IPv6)
- deny (MAC)
- deny icmp
- deny icmp (IPv6)
- deny ip
- deny ipv6
- deny tcp
- deny tcp (IPv6)
- deny udp
- deny udp (IPv6)
- description
- ip access-group
- ip access-list
- ip as-path access-list
- ip community-list standard deny
- ip community–list standard permit
- ip extcommunity-list standard deny
- ip extcommunity-list standard permit
- ip prefix-list description
- ip prefix-list deny
- ip prefix-list permit
- ip prefix-list seq deny
- ip prefix-list seq permit
- ipv6 access-group
- ipv6 access-list
- ipv6 prefix-list deny
- ipv6 prefix-list description
- ipv6 prefix-list permit
- ipv6 prefix-list seq deny
- ipv6 prefix-list seq permit
- mac access-group
- mac access-list
- permit
- permit (IPv6)
- permit (MAC)
- permit icmp
- permit icmp (IPv6)
- permit ip
- permit ipv6
- permit tcp
- permit tcp (IPv6)
- permit udp
- permit udp (IPv6)
- remark
- seq deny
- seq deny (IPv6)
- seq deny (MAC)
- seq deny icmp
- seq deny icmp (IPv6)
- seq deny ip
- seq deny ipv6
- seq deny tcp
- seq deny tcp (IPv6)
- seq deny udp
- seq deny udp (IPv6)
- seq permit
- seq permit (IPv6)
- seq permit (MAC)
- seq permit icmp
- seq permit icmp (IPv6)
- seq permit ip
- seq permit ipv6
- seq permit tcp
- seq permit tcp (IPv6)
- seq permit udp
- seq permit udp (IPv6)
- show access-group
- show access-lists
- show acl-table-usage detail
- show ip as-path-access-list
- show ip community-list
- show ip extcommunity-list
- show ip prefix-list
- show logging access-list
- Route-map commands
- continue
- match as-path
- match community
- match extcommunity
- match interface
- match ip address
- match ip next-hop
- match ipv6 address
- match ipv6 next-hop
- match metric
- match origin
- match route-type
- match tag
- route-map
- set comm-list add
- set comm-list delete
- set community
- set extcomm-list add
- set extcomm-list delete
- set extcommunity
- set local-preference
- set metric
- set metric-type
- set next-hop
- set origin
- set tag
- set weight
- show route-map
- Quality of service
- Configure quality of service
- Ingress traffic classification
- Egress traffic classification
- Policing traffic
- Mark Traffic
- Color traffic
- Modify packet fields
- Shaping traffic
- Bandwidth allocation
- Strict priority queuing
- Rate adjustment
- Buffer management
- Congestion avoidance
- Storm control
- RoCE for faster access and lossless connectivity
- QoS commands
- bandwidth
- buffer-statistics-tracking
- class
- class-map
- clear interface
- clear qos statistics
- clear qos statistics type
- control-plane
- control-plane-buffer-size
- flowcontrol
- hardware deep-buffer-mode
- match
- match cos
- match dscp
- match precedence
- match queue
- match vlan
- mtu
- pause
- pfc-cos
- pfc-max-buffer-size
- pfc-shared-buffer-size
- pfc-shared-headroom-buffer-size
- police
- policy-map
- priority
- priority-flow-control mode
- qos-group dot1p
- qos-group dscp
- qos-rate-adjust
- queue-limit
- queue bandwidth
- queue qos-group
- random-detect (interface)
- random-detect (queue)
- random-detect color
- random-detect ecn
- random-detect ecn
- random-detect pool
- random-detect weight
- service-policy
- set cos
- set dscp
- set qos-group
- shape
- show class-map
- show control-plane buffers
- show control-plane buffer-stats
- show control-plane info
- show control-plane statistics
- show hardware deep-buffer-mode
- show interface priority-flow-control
- show qos interface
- show policy-map
- show qos control-plane
- show qos egress bufffers interface
- show qos egress buffer-statistics-tracking
- show qos egress buffer-stats interface
- show qos headroom-pool buffer-statistics-tracking
- show qos ingress buffers interface
- show qos ingress buffer-statistics-tracking
- show qos ingress buffer-stats interface
- show qos-rate-adjust
- show qos service-pool buffer-statistics-tracking
- show qos system
- show qos system buffers
- show qos maps
- show qos wred-profile
- show queuing statistics
- system qos
- trust-map
- trust dot1p-map
- trust dscp-map
- qos-map traffic-class
- trust-map
- wred
- Virtual Link Trunking
- Uplink Failure Detection
- Converged data center services
- sFlow
- Telemetry
- RESTCONF API
- Troubleshoot OS10
- Diagnostic tools
- Password recovery
- Restore factory defaults
- SupportAssist
- Support bundle
- System monitoring
- Log into OS10 device
- Frequently asked questions
- Support resources

Encoding : gpb
Transport : grpc TLS : disabled
Source Interface : ethernet1/1/1
Active : true
Reason : Connection summary: One or more active connections
The connection 10.11.56.204:40001 is in connected state
Verify telemetry in running configuration
OS10# show running-configuration telemetry
!
telemetry
enable
!
destination-group dest1
destination 10.11.56.204 40001
!
subscription-profile subscription-1
destination-group dest1
sensor-group bgp 300000
sensor-group bgp-peer 0
sensor-group buffer 15000
sensor-group device 300000
sensor-group environment 300000
sensor-group interface 180000
sensor-group lag 0
sensor-group system 300000
encoding gpb
transport grpc no-tls
source-interface ethernet1/1/1
Telemetry commands
debug telemetry
Starts data collection to troubleshoot telemetry operation.
Syntax
debug telemetry
Parameters None
Default Not configured
Command mode EXEC
Usage
information
When an error condition occurs, use the debug telemetry command to store telemetry data in a
debug file. The telemetry debug file is stored at /var/log/grpc_server.log.
Example
OS10# debug telemetry
Supported
releases
10.4.3.0 or later
destination
Configures a destination management device that receives streaming telemetry.
Syntax
destination {ip-address | domain-name} port-number
Parameters
● ip-address — Enter the IPv4 or IPv6 address of the destination device. You can enter a fully
qualified domain name (FQDN). The destination domain name resolves to an IP address — see System
domain name and list.
Telemetry 1083