
User's Manual

Understanding Dell Server Management Pack Suite Operations 39
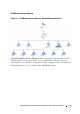
• iDRAC 6 Enterprise Modular
•iDRAC 6
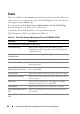
The health of a component is derived by reviewing the unresolved alerts
associated with the component. Table 3-1 explains the various state
components that the Dell Server Management Pack Suite v4.0 uses with their
corresponding severity levels.
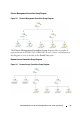
Performance and Power Monitoring Views
This view is available for managing Dell Windows systems only. In the
Operations Console, Dell→ Performance and Power Monitoring Views
displays the power management information that is collected as performance
data from Dell Systems. Power monitoring includes the following parameters:
• Amperage Per Power supply
• Power Consumption (in Watts)
• Power Consumption (in BTU/hr)
• Energy Consumption
•Peak Power
•Peak Amperage
• Ambient Temperature
NOTE: Power Monitoring is applicable for specific Dell Systems with Power
Monitoring capability for that particular attribute.
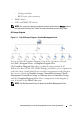
Select the counters (under legend), from the individual performance views
and select the time range for which the values are required. The data
collected is represented in a graphical format for each system.
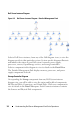
A unit monitor monitors the performance counter over two successive cycles
to check if it exceeds a threshold value. When the condition is breached,
the server changes state and generates an alert. This unit monitor is disabled
by default. You can override (enable and modify) the threshold values from
the Authoring pane of the Operations console, under Monitors for Dell
Windows Server objects.
For more information on performance information collection,
see "Performance Collection Rules."