
Users Guide

• Remote Access Alerts — These alerts contains information on SNMP traps from iDRAC6, iDRAC7 and iDRAC8 devices.
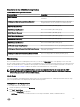
3. Select an alert to view the details in the Alert Details pane.
On the right pane of each of the individual Alerts Views, alerts that meet the criteria you specify, such as alert severity,
resolution state, or alerts that are assigned to you is displayed.
Diagram Views
The Diagram Views offers a hierarchical and graphical representation of all Dell DRAC devices on the network.
Viewing Diagrams On The OpsMgr Console
To view the diagrams for DRAC monitoring feature on the OpsMgr console:
1. Launch the OpsMgr console and click Monitoring → Dell → Diagram Views.
2. In the Monitoring pane on the left side, navigate to the Diagram Views folder for the following views:
• Complete Diagram View
• Remote Access Controllers Group
3. Select any of the Diagram Views.
On the right pane the hierarchical and graphical representation of the selected Dell device is displayed.
4. Select a component in the diagram to view its details in the Detail View pane.
Remote Access Controllers Group
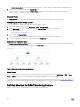
The Remote Access Controllers Group diagram view offers a graphical representation of all iDRAC6, iDRAC7 and iDRAC8 devices.
Select a component in the diagram to view its details in the Detail View pane.
Figure 5. Remote Access Controllers Group Diagram
State Views
This view is available for viewing the health of the Dell DRAC devices. In the OpsMgr console, click Monitoring → Dell → State
Views → DRAC, the status of each Dell DRAC device managed by OpsMgr on the network is displayed.
The health of a component is derived by reviewing the unresolved alerts associated with the component. Severity Level Indicators
explains the various state components that the Dell Server Management Pack Suite uses with their corresponding severity levels.
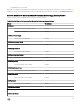
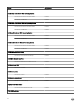
Dell Unit Monitors for DRAC Monitoring Feature
Monitors to assess various conditions that can occur in DRAC monitored objects.
60