
Users Guide
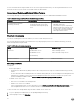
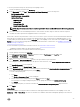

Discovery Object Description
Dell Host NIC Correlation Discovery
Correlates the Host NIC interfaces with Physical interfaces.
NOTE: Teamed network interfaces will show only one of
the NICs in the team.
Monitoring
After you install the Dell Server Management Pack Suite, you can use the Monitoring pane of the OpsMgr to select views that
provide health information of the discovered Dell servers. The Server and Rack Workstation Monitoring (Licensed) feature
discovers and monitors the health of the Dell servers.
NOTE: To be able to receive SNMP alerts from devices discovered through the iDRAC access via Host OS feature, you
must install SNMP services on the Managed Node and set the Management Server IP address as the trap destination in
the
SNMP Services.
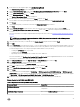
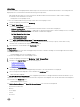
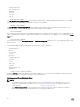
To install SNMP services on the Managed Node, perform the following steps:
1. Navigate to Server Manager → Roles and Features → Features for the managed node.
2. Install SNMP Services.
3. From the list of available services, right-click SNMP Services and select Properties.
4. In the SNMP Services Properties (Local Computer) window, select the Traps tab.
5. Set a Community string in the Community name field and provide the Management Server IP address in the Trap
Destinations field and then click OK.
You will now be able to receive SNMP traps for the node discovered through iSM using the iDRAC access via Host OS
(Experimental) method.
The Severity Level Indicators indicates the health of the Dell servers on the network. It includes monitoring health of Dell modular,
monolithic systems and supported Dell Precision Racks and their components at regular intervals.
As the system components monitored through Server and Rack Workstation Monitoring, which is a license free monitoring
feature, and the Server and Rack Workstation Monitoring (Licensed) feature are not exactly the same, it is possible that the
overall server health that is shown through license-free (OMSA) and licensed (iDRAC using WS-MAN, iDRAC access via Host OS,
or iSM using WMI) methods could be different. Drill-down to the specific component status when you observe such discrepancies
to resolve specific problem conditions in the system component to bring the overall health of the server to OK state.
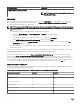
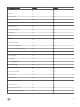
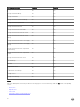
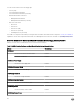
Monitored hardware components
The following table provides information about the monitored hardware components supported in Scalable and Detailed feature for
devices discovered through iDRAC using WS-MAN.
Table 13. Monitored hardware components — Scalable and Detailed feature (iDRAC using WS-MAN)
Hardware components Scalable Detailed
BIOS
No No
Battery Sensor
No Yes
Battery Sensor Group
No Yes
Current Sensor
No Yes
Current Sensor Group
No Yes
Fan Sensor
No Yes
34