
Users Guide


• Dell Server State Views
– FM Servers
– Sled Servers (Agent-free)
– Unmanaged Servers (Agent-free)
The health of a component is derived by reviewing the unresolved alerts associated with the component.
Severity Level Indicators explains the various state components that the Dell Server Management Pack
Suite uses with their corresponding severity levels.
Performance and Power Monitoring Views
To view the performance and power monitoring on the OpsMgr console:
1. Launch the OpsMgr console and click Monitoring.
2. In the Monitoring pane, click Dell → Performance and Power Monitoring for the following views:
• Agent-free Disk Performance (%)
• Dell Performance View
• System Board Usage
– CPU Usage (%)
– IO Usage (%)
– Memory Usage (%)
– Overall System Usage (%)
NOTE: All performance metric rules are disabled by default for Agent-free monitoring feature.
3. Select the counters from the individual performance views and select the time range for which the
values are required.
The data collected is represented in a graphical format for each system.
A unit monitor, monitors the performance counter over two successive cycles to check if it exceeds a
threshold value. When the threshold value is exceeded, the server changes state and generates an alert.
This unit monitor is disabled by default. You can override (enable and modify) the threshold values from
the Authoring pane of the OpsMgr console. Unit monitor is available under Monitors for Dell Server
objects for Agent-free monitoring feature.
Dell Unit Monitors for Agent-free Monitoring Feature
Monitors to assess various conditions that can occur in Agent-free monitored objects.
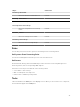
Table 14. Dell Unit Monitors For Agent-free Monitoring
Object Unit Monitor
Dell Server
Dell Server Run As Account Association Periodic
Dell Server Unit Monitor Periodic
Dell Server Power Supply
41