
Users Guide

– Sled Servers (Agent-based)
The health of a component is derived by reviewing the unresolved alerts associated with the component.
Performance and Power Monitoring Views
To view the performance and power monitoring on the OpsMgr console:
1. Launch the OpsMgr console and click Monitoring.
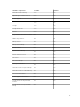
2. In the Monitoring pane, click Dell → Performance and Power Monitoring for the following views:
• Agent-based Disk Performance (%)
• Ambient Temperature (Centigrade)
• Amperage (Amps)
• Energy Consumption (kWh)
• Peak Amperage (Amps)
• Peak Power (Watts)
• Physical Network Interface
• Power Consumption (Watts)
• Power Consumption (BTU/hr)
• Teamed Network Interface
NOTE: Power monitoring is applicable only for Dell servers with power monitoring capability for
a particular attribute. It is enabled only when the detailed edition of Agent-based monitoring
feature is present.
NOTE: Agent-based Disk Performance (%), Teamed and Physical network interface instances
are disabled by default and appears only when the detailed edition of the Agent-based
monitoring feature is installed and imported.
3. Select the counters from the individual performance views and select the time range for which the
values are required.
The data collected is represented in a graphical format for each system.
A unit monitor, monitors the performance counter over two successive cycles to check if it exceeds a
threshold value. When the threshold value is exceeded, the Dell server changes state and generates an
alert. This unit monitor is disabled by default. You can override (enable and modify) the threshold values
from the Authoring pane of the OpsMgr console. Unit monitor is available under Monitors for Dell
Windows Server objects for Agent-based monitoring feature.
For more information on performance information collection, see Performance Collection Rules.
Unit Monitors
Unit monitors assess the various conditions that can occur in monitored objects. The result of this
assessment determines the health state of a target.
The unit monitors are:
• Event Monitor — triggered by the event that the Dell instrumentation logs in the Windows event log,
indicating the health of the corresponding object.
• Periodic Monitor — triggered by a periodic poll configured as Interval Seconds.
19