
Users Guide

Discovery Object Description
NOTE: Teamed network interfaces will show only one of
the NICs in the team.
Monitoring
After you install the Dell Server Management Pack Suite, you can use the Monitoring pane of the OpsMgr to select views that provide
health information of the discovered Dell servers. The Agent-free monitoring feature discovers and monitors the health of the Dell servers.
The Severity Level Indicators indicates the health of the Dell servers on the network. It includes monitoring health of Dell modular,
monolithic systems and supported Dell Precision Racks and their components at regular intervals and on occurrence of events.
As the system components monitored through Agent-based monitoring feature and Agent-free monitoring feature are not exactly the
same, it is possible that the overall server health that is shown through Agent-based (OMSA) and Agent-free (iDRAC) methods could be
different. Drill-down to the specific component status when you observe such discrepancies to resolve specific problem conditions in the
system component to bring the overall health of the server to OK state.
Views
Dell Server Management Pack Suite provides the following types of views for Monitoring, under the Dell folder on the OpsMgr console:
• Alerts Views
• Diagram Views
• State Views
• Performance and Power Monitoring Views
Alerts Views
This view is available for managing hardware and storage events from Dell servers and Rack Workstations. The following alerts and traps
are displayed by the Agent-free monitoring feature:
• Link up or Link down alerts for events received from Broadcom and Intel network interface cards for Dell PowerEdge, PowerVault
systems and Dell Precision Racks.
• Platform Event Traps (PET) for Dell servers and Rack Workstations.
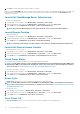
Viewing Alerts on the OpsMgr Console
To view Agent-free monitoring feature alerts on the OpsMgr console:
1. Launch the OpsMgr console and click Monitoring.
2. Click Dell > Alerts Views.
The following Alerts Views are displayed:
• Server and Rack Workstation Alerts — SNMP traps for 12th and 13th generation of Dell PowerEdge servers, PowerVault
storage servers and Dell Precision Racks with iDRAC7 or iDRAC8 are displayed.
• Dell Rack Workstation Alert Views
• Rack Workstation Alerts
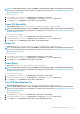
3. Select Server and Rack Workstation Alerts or Rack Workstation Alerts.
On the right pane of each of the individual Alerts Views, alerts that meet the criteria you specify, such as alert severity, resolution
state, or alerts that are assigned to you is displayed.
4. Select an alert to view the details in the Alert Details pane.
Diagram Views
The Diagram Views offers a hierarchical and graphical representation of all Dell servers and supported Rack Workstations on the
network.
Viewing Diagram Views On The OpsMgr Console
To view the Agent-free Monitoring diagram views on the OpsMgr console:
1. Launch the OpsMgr console and click Monitoring > Dell > Diagram Views.
Agent-free Monitoring Feature
29