
Users Guide


• Monolithic Servers Diagram
3. Select any of the Diagram Views.
On the right pane the hierarchical and graphical representation of the selected Dell server or Rack Workstation is displayed.
4. Select a component in the diagram to view its details in the Detail View pane.
Complete Diagram View
The Complete Diagram View offers a graphical representation of all Dell devices that OpsMgr monitors. You can expand and verify the
status of individual devices and their components in the diagram. You can view the details for the following:
• Dell Modular and Monolithic Servers
• Dell Rack Workstations
• Chassis Management Controllers
• Remote Access Controllers
• Dell Unmanaged Systems
Modular and Monolithic Systems
The Modular Systems Diagram and Monolithic Servers Diagram views offer the following details:
• Physical and teamed network interfaces
• Memory
• Power supply
• Sensors
• Processors
• Dell OpenManage software services
• Storage components
• BIOS (inventory only)
• iDRAC
Modular Systems Diagram
The Dell Modular Systems Diagram View offers a graphical representation of all Dell modular systems and allows you to expand and
verify the status of individual devices and their components in the diagram.
Monolithic Servers Diagram
The Dell Monolithic Systems Diagram View offers a graphical representation of all Dell monolithic systems and allows you to expand
and verify the status of individual devices and their components in the diagram.
Rack Workstation Diagram
The Dell Rack Workstation Diagram Views offers a graphical representation of all supported Rack Workstations and allows you to
expand and verify the status of individual devices and their components in the diagram. Select a Rack Workstation in the diagram to view
its details in the
Detail View pane.
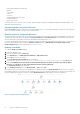
Dell Server Instance Diagram
Select a Dell server from the Dell Modular System or Dell Monolithic System diagram views, to view the diagram specific to that
particular system.
Figure 1. Dell Server Instance Diagram
System-specific diagrams illustrate and indicate the status of the following components:
Agent-based Monitoring Feature
13