
Users Guide

Viewing Alerts On The OpsMgr Console
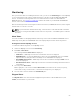
To view DRAC alerts on the OpsMgr console:
1. Launch the OpsMgr console and click Monitoring.
2. Click Dell → Alerts Views → Remote Access Alerts.
The Remote Access Alerts is displayed. These alerts contains information on SNMP traps from DRAC
5, iDRAC 6, and iDRAC 7 devices.
3. Select an alert to view the details in the Alert Details pane.
On the right pane of each of the individual Alerts Views, alerts that meet the criteria you specify,
such as alert severity, resolution state, or alerts that are assigned to you is displayed.
Diagram Views
The Diagram Views offers a hierarchical and graphical representation of all Dell DRAC devices on your
network.
Viewing Diagrams On The OpsMgr Console
To view the diagrams for DRAC monitoring feature on the OpsMgr console:
1. Launch the OpsMgr console and click Monitoring → Dell → Diagram Views.
2. In the Monitoring pane on the left side, navigate to the Diagram Views folder for the following views:
• Complete Diagram View
• Remote Access Controllers Group
3. Select any of the Diagram Views.
On the right pane the hierarchical and graphical representation of the selected Dell device is
displayed.
4. Select a component in the diagram to view its details in the Detail View pane.
Complete Diagram View
The Complete Diagram View offers a graphical representation of all Dell devices that OpsMgr monitors.
You can expand and verify the status of individual devices and their components in the diagram. You can
view details for:
• Modular and Monolithic systems
• Chassis Management Controllers and DRAC/MC devices
• Remote Access Controllers
• Dell Unmanaged Servers
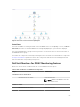
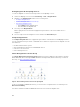
Remote Access Controllers Group
The Remote Access Controllers Group diagram view offers a graphical representation of all DRAC 5,
iDRAC 6, and iDRAC 7 (modular and monolithic) devices. Select a component in the diagram to view its
details in the Detail View pane.
52