
Users Guide


Command History
This guide is platform-specific. For command information about other platforms, see
the relevant Dell Networking OS Command Line Reference Guide.
Version Description
9.10(0.1) Introduced on the S6010-ON and S4048T-ON.
9.8(1.0) Introduced on the Z9100–ON.
9.8(0.0P5) Introduced on the S4048-ON.
9.8(0.0P2) Introduced on the S3048-ON.
9.7(0.0) Introduced on the S6000-ON.
9.0.2.0 Introduced on the S6000.
8.3.19.0 Introduced on the S4820T.
8.3.11.0 Introduced on the Z9000.
8.3.7.0 Introduced on the S4810.
7.8.1.0 Introduced on the S-Series.
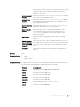
show hardware stack-unit
Display the data plane or management plane input and output statistics of the designated component of the
designated stack member.
Syntax
stack-unit stack-unit-number {buffer [ unit 0 ] total buffer |
buffer unit 0 interface all queue [(0-14) | a11] buffer-info}{cpu
data-plane statistics | cpu management statistics | drops [unit
number] | fpga register | party-bus statistics | stack-port | ti-
monitor | unit 0-1 {counters | details | port-stats [detail] |
register}}
Parameters
stack-unit stack-
unit-number
{command-
option}
Enter the keywords stack-unit to select a particular stack
member and then enter one of the following command options
to display a collection of data based on the option entered. The
range is from 1 to 6.
buffer Enter the keyword buffer. To display the total buffer statistics
for the stack unit, enter the keyword total-buffer. To display
buffer statistics for a all interface, enter the keyword
interface
followed by the keyword all.
To display total buffer information for the port, enter the
keywords buffer-info. To display a queue range, enter 0 to 14
for a specfic queue or all.
cpu data-plane
statistics
Enter the keywords cpu data-plane statistics then the
keywords stack port and its number, from 1 to 72 to display
Debugging and Diagnostics 667