
Users Guide


3.40% CoreID: 0
Process: sysd PID: 410 CPU usage: 5sec - 1.59% 1min - 0.96% 5min -
2.50% CoreID: 2
TID Runtime(ms) Invoked uSecs 5Sec 1Min 5Min
TTY Thread
56 20 2 10000 0.00% 0.00% 0.00%
0 usm
55 10 1 10000 0.00% 0.00% 0.00%
0 DHCLIENT
54 0 0 0 0.00% 0.00% 0.00%
0 cms
53 60 6 10000 0.00% 0.00% 0.00%
0 portmirr
52 0 0 0 0.00% 0.00% 0.00%
0 cfgDataSync
51 0 0 0 0.00% 0.00% 0.00%
0 sysCompMgr
50 50 5 10000 0.00% 0.01% 0.00%
0 statMgr
49 1010 101 10000 0.05% 0.07% 0.08%
0 sflCp
48 30 3 10000 0.00% 0.00% 0.00%
0 snmp
47 0 0 0 0.00% 0.00% 0.00%
0 dpi_cmow
46 0 0 0 0.00% 0.00% 0.00%
0 dpi_taskcmo
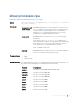
Dell# show processes cpu management-unit details ?
| Pipe through a command
Dell# show processes cpu management-unit ?
<1-99> Number of tasks with highest CPU usage
last 5 seconds
details Detail CPU utilization
| Pipe through a command
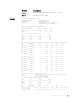
Dell# show processes cpu management-unit
CPUID 5sec 1min 5min
--------------------------------------------------
CORE 0 9.54 9.92 12.82
CORE 2 10.74 11.56 14.31
Overall 10.14 10.74 13.56
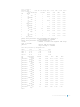
PID Runtime(ms) Invoked uSecs 5Sec 1Min 5Min
TTY Process
0x00000000 45040 4504 10000 13.12% 13.20% 12.94%
0 system
0x000001ac 25750 2575 10000 2.78% 2.48% 3.40%
0 sysdlp
0x0000019a 10650 1065 10000 0.60% 1.16% 2.50%
0 sysd
0x000003a5 860 86 10000 0.40% 0.22% 0.28%
0 clish
0x000001ad 520 52 10000 0.20% 0.30% 0.16%
0 lacp
0x000004ba 330 33 10000 0.20% 0.36% 0.09%
0 clish
0x000000c9 1240 124 10000 0.20% 0.15% 0.44%
0 nvmgr
0x000000e0 530 53 10000 0.20% 0.12% 0.16%
0 igmp
0x00000132 420 42 10000 0.20% 0.10% 0.13%
0 vrrp
0x0000028d 410 41 10000 0.20% 0.05% 0.12%
0 ovsdbsvr
0x000000a9 200 20 10000 0.20% 0.03% 0.06%
0 arpm
0x00000253 100 10 10000 0.20% 0.02% 0.02%
0 otm
0x00000206 140 14 10000 0.20% 0.02% 0.03%
0 tnlmgr
0x00000012 1290 129 10000 0.00% 0.10% 0.12%
0 mount_mfs
0x0000024d 40 40 10000 0.00% 0.08% 0.14%
0 xstp
Dell#
Control and Monitoring 169