
Users Guide


Version Description
6.2.1.1 Introduced on the E-Series.
Usage Information Traffic statistics are sorted on a per-interface basis; the interface receiving the most
traffic is displayed first. All CPU and port information is displayed unless a specific port
or CPU is specified. Traffic information is displayed for router ports only; not for
management interfaces. The traffic statistics are collected only after the debug cpu-
traffic-stats command is executed; not from the system bootup.
NOTE: After debugging is complete, use the no debug cpu-traffic-stats
command to shut off traffic statistics collection.
Example
Dell# show cpu-traffic-stats
Processor : CP
--------------
Received 100% traffic on TenGigabitEthernet 8/2 Total packets:100
LLC:0, SNAP:0, IP:100, ARP:0, other:0
Unicast:100, Multicast:0, Broadcast:0
Processor : RP1
---------------
Received 62% traffic on TenGigabitEthernet 8/2 Total packets:500
LLC:0, SNAP:0, IP:500, ARP:0, other:0
Unicast:500, Multicast:0, Broadcast:0
Received 37% traffic on TenGigabitEthernet 8/1 Total packets:300
LLC:0, SNAP:0, IP:300, ARP:0, other:0
Unicast:300, Multicast:0, Broadcast:0
Processor : RP2
---------------
No CPU traffic statistics.
Dell#
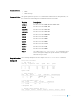
show debugging
View a list of all enabled debugging processes.
Syntax
show debugging
Command Modes EXEC Privilege
Command History
This guide is platform-specific. For command information about other platforms, see
the relevant Dell Networking OS Command Line Reference Guide.
Version Description
9.10(0.1) Introduced on the S6010-ON and S4048T-ON.
9.8(1.0) Introduced on the Z9100–ON.
9.8(0.0P5) Introduced on the S4048-ON.
9.8(0.0P2) Introduced on the S3048-ON.
9.7(0.0) Introduced on the S6000-ON.
Control and Monitoring 157