
Users Guide
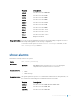


enable option usage: 0
line option usage: 0
none option usage: 0
radius option usage: 1
tacacs+ option usage: 0
Dell#
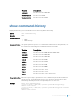
show cpu-traffic-stats
View the CPU traffic statistics.
Syntax
show cpu-traffic-stats [port number | all | cp ]
Parameters
port number (OPTIONAL) Enter the port number to display traffic statistics on
that port only. The range is from 1 to 1568.
all (OPTIONAL) Enter the keyword all to display traffic statistics on
all the interfaces receiving traffic, sorted based on the traffic.
cp (OPTIONAL) Enter the keyword cp to display traffic statistics on
the specified CPU.
Defaults all
Command Modes EXEC
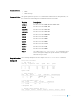
Command History
This guide is platform-specific. For command information about other platforms, see
the relevant Dell Networking OS Command Line Reference Guide.
Version Description
9.10(0.1) Introduced on the S6010-ON and S4048T-ON.
9.8(1.0) Introduced on the Z9100–ON.
9.8(0.0P5) Introduced on the S4048-ON.
9.8(0.0P2) Introduced on the S3048-ON.
9.7(0.0) Introduced on the S6000-ON.
9.2(1.0) Introduced on the Z9500.
9.0.2.0 Introduced on the S6000.
9.0.0.0 Introduced on the Z9000.
8.3.19.0 Introduced on the S4820T.
8.3.12.0 Introduced on the S4810.
8.3.11.1 Introduced on the Z9000.
7.6.1.0 Introduced on the S-Series.
7.5.1.0 Introduced on the C-Series
Control and Monitoring 156