
Users Guide


Version Description
9.7(0.0) Introduced on the S6000-ON.
9.2(1.0) Introduced on the Z9500.
9.0.2.0 Introduced on the S6000.
9.0.0.0 Introduced on the Z9000.
8.3.19.0 Introduced on the S4820T.
8.3.12.0 Introduced on the S4810.
8.3.11.1 Introduced on the Z9000.
7.6.1.0 Introduced on the S-Series.
7.5.1.0 Introduced on the C-Series
6.2.1.1 Introduced on the E-Series.
Usage Information Trac statistics are sorted on a per-interface basis; the interface receiving the most trac is displayed rst. All
CPU and port information is displayed unless a specic port or CPU is specied. Trac information is displayed for
router ports only; not for management interfaces. The trac statistics are collected only after the debug cpu-
traffic-stats command is executed; not from the system bootup.
NOTE: After debugging is complete, use the no debug cpu-traffic-stats command to shut o
trac statistics collection.
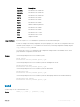
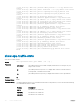
Example
Dell# show cpu-traffic-stats
Processor : CP
--------------
Received 100% traffic on GigabitEthernet 8/2 Total packets:100
LLC:0, SNAP:0, IP:100, ARP:0, other:0
Unicast:100, Multicast:0, Broadcast:0
Processor : RP1
---------------
Received 62% traffic on GigabitEthernet 8/2 Total packets:500
LLC:0, SNAP:0, IP:500, ARP:0, other:0
Unicast:500, Multicast:0, Broadcast:0
Received 37% traffic on GigabitEthernet 8/1 Total packets:300
LLC:0, SNAP:0, IP:300, ARP:0, other:0
Unicast:300, Multicast:0, Broadcast:0
Processor : RP2
---------------
No CPU traffic statistics.
Dell#
show debugging
View a list of all enabled debugging processes.
Syntax
show debugging
Command Modes EXEC Privilege
Command History
This guide is platform-specic. For command information about other platforms, see the relevant Dell Networking
OS Command Line Reference Guide.
Control and Monitoring 129