
Users Guide
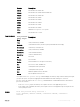


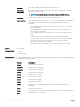

Version Description
9.8(1.0) Introduced on the Z9100–ON.
9.8(0.0) Introduced on the S3048-ON and S4048-ON.
9.7(0.0) Introduced on the S6000-ON.
9.0.2.0 Introduced on the S6000.
9.0.0.0 Introduced on the Z9000.
8.3.19.0 Introduced on the S4820T.
8.3.12.0 Introduced on the S4810.
8.3.11.1 Introduced on the Z9000.
7.7.1.0 Added the management-unit option.
7.6.1.0 Introduced on the S-Series.
Usage Information
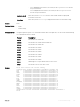
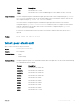
show processes
memory output
Field
Description
Total: Total system memory available
MaxUsed: Total maximum memory used ever (history indicated with time stamp)
CurrentUsed: Total memory currently in use
CurrentFree: Total system memory available
SharedUsed: Total used shared memory
SharedFree: Total free shared memory
PID Process ID
Process Process Name
ResSize Actual resident size of the process in memory
Size Process test, stack, and data size
Allocs Total dynamic memory allocated
Frees Total dynamic memory freed
Max Maximum dynamic memory allocated
Current Current dynamic memory in use
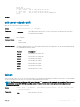
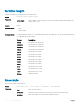
The output for the show process memory command displays the memory usage statistics running on CP part
(sysd) of the system. The sysd is an aggregate task that handles all the tasks running on S-Series’ CP.
For the S-Series, the output of the show memory command and this command differ based on which Dell OS
processes are counted.
• In the show memory output, the memory size is equal to the size of the application processes.
• In the output of this command, the memory size is equal to the size of the application processes plus the size
of the system processes.
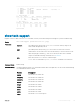
Example
Dell# show processes memory stack-unit 1
Total: 268435456, MaxUsed: 2420244, CurrentUsed: 2420244, CurrentFree:
266015212
Control and Monitoring 141