
Users Guide


Version Description
9.0.0.0 Introduced on the Z9000.
8.3.19.0 Introduced on the S4820T.
8.3.12.0 Introduced on the S4810.
8.3.11.1 Introduced on the Z9000.
7.7.1.0 Added the management-unit option.
7.6.1.0 Introduced on the S-Series.
Usage Information
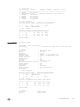
show processes
memory output
Field
Description
Total: Total system memory available
MaxUsed: Total maximum memory used ever (history indicated with time stamp)
CurrentUsed: Total memory currently in use
CurrentFree: Total system memory available
SharedUsed: Total used shared memory
SharedFree: Total free shared memory
PID Process ID
Process Process Name
ResSize Actual resident size of the process in memory
Size Process test, stack, and data size
Allocs Total dynamic memory allocated
Frees Total dynamic memory freed
Max Maximum dynamic memory allocated
Current Current dynamic memory in use
The output for the show process memory command displays the memory usage statistics running on
CP part (sysd) of the system. The sysd is an aggregate task that handles all the tasks running on S-Series’
CP.
For the S-Series, the output of the show memory command and this command dier based on which
FTOS processes are counted.
• In the show memory output, the memory size is equal to the size of the application processes.
• In the output of this command, the memory size is equal to the size of the application processes plus the
size of the system processes.
Example
Dell#show processes memory stack-unit 1
Total: 268435456, MaxUsed: 2420244, CurrentUsed: 2420244, CurrentFree:
266015212
TaskName TotalAllocated TotalFreed MaxHeld CurrentHolding
tme 435406 397536 54434 37870
ipc 16652 0 16652 16652
timerMgr 33304 0 33304 33304
sysAdmTsk 33216 0 33216 33216
tFib4 1943960 0 1943960 1943960
aclAgent 90770 16564 74206 74206
Control and Monitoring
141