
Reference Guide


Control and Monitoring | 61
show processes ipc flow-control
Displays the Single window protocol queue (SWPQ) statistics.
Syntax
show processes ipc flow-control [cp]
Parameters
Defaults
none
Command Modes
EXEC
EXEC Privilege
Command
History
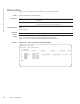
Example 1
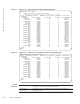
Figure 5-21. show processes ipc flow-control Command Example
Table 5-1 lists the definitions of the fields shown in Figure 5-21.
show interfaces
stack-unit
Displays information on all interfaces on a specific stack member.
show processes
memory
Displays CPU usage information based on running processes
cp (OPTIONAL) Enter the keyword cp to view the Control Processor’s SWPQ
statistics.
Version 8.3.17.0 Supported on M I/O Aggregator
FTOS#show process ipc flow-control
Q Statistics on CP Processor
TxProcess RxProcess Cur High Time Retr Msg Ack Aval Max
Len Mark Out ies Sent Rcvd Retra Retra
ACL0 RTM0 0 0 0 0 0 0 10 10
ACL0 DIFFSERV0 0 0 0 0 0 0 10 10
ACL0 IGMP0 0 0 0 0 0 0 10 10
ACL0 PIM0 0 0 0 0 0 0 10 10
LACP0 IFMGR0 0 24 0 0 34 34 25 25
STP0 L2PM0 0 0 0 0 0 0 25 25
L2PM0 STP0 0 1 0 0 2 2 25 25
FRRP0 L2PM0 0 0 0 0 0 0 25 25
DHCP0 ACL0 0 0 0 0 0 0 25 25
DHCP0 IPMGR0 0 0 0 0 0 0 25 25
DHCP0 IFMGR0 0 0 0 0 0 0 25 25
SMUX0 IFMGR0 0 38 0 0 47 47 60 60
SMUX0 LACP0 0 1 0 0 3 3 60 60
--More--
FTOS#
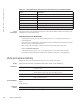
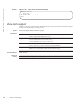
Table 5-1. Description of the show processes ipc flow-control cp output Command
Field Description
Source QID /Tx Process Source Service Identifier
Destination QID/Rx Process Destination Service Identifier
Cur Len Current number of messages enqueued