
Command Line Reference Guide


stack-unit 0–5 (OPTIONAL) Enter the keywords stack-unit then the stack
member ID. The range is from 0 to 5.
As an option of the show processes cpu command, this
option displays CPU usage for the designated stack member.
Or, as an option of memory, this option limits the output of
memory statistics to the designated stack member. Refer to
Example (stack-unit).
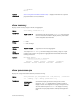
summary (OPTIONAL) Enter the keyword summary to view a summary
view CPU utilization of processes related to line card
processing. Refer to Example (summary).
ipc (OPTIONAL) Enter the keyword ipc to display interprocess
communication statistics.
memory (OPTIONAL) Enter the keyword memory to display memory
statistics. Refer to Example (memory).
Command
Modes
• EXEC
• EXEC Privilege
Command
History
Version 8.3.17.0 Supported on the M I/O Aggregator.
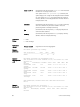
Example
(summary)
Dell#show processes cpu summary
CPU utilization 5Sec 1Min 5Min
-------------------------------------------
UNIT1 4% 3% 2%
Example
(management-
unit)
Dell#show processes cpu management-unit 5
CPU utilization for five seconds: 4%/0%; one minute: 4%; five
minutes: 4%
PID Runtime(ms) Invoked uSecs 5Sec 1Min 5Min TTY
Process
0x00000000 2120 212 10000 3.77% 3.77% 3.77% 0
system
0x00000112 2472940 247294 10000 0.79% 0.61% 0.65% 0
sysdlp
0x000000e4 495560 49556 10000 0.20% 0.25% 0.24% 0
sysd
0x0000013d 34310 3431 10000 0.00% 0.02% 0.00% 0
lacp
0x00000121 4190 419 10000 0.00% 0.02% 0.00% 0
iscsiOpt
PID Runtime(ms) Invoked uSecs 5Sec 1Min 5Min TTY Process
Dell#
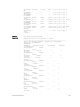
Example
(stack-unit)
Dell#show process cpu stack-unit 1
CPU utilization for five seconds: 4%/0%; one minute: 3%; five
minutes: 2%
PID Runtime(ms) Invoked uSecs 5Sec 1Min 5Min TTY
Process
68
Control and Monitoring