
Users Guide

************************************* END
**************************************
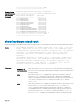
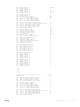
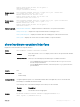
Example 4 (show
diag testcase stack-
unit interactive
Command)
Dell#show diag testcase stack-unit 0 interactive
**************************** Navasota Diagnostics Test
*************************
Test ID Test Description Test Level
------- ---------------- ----------
401 POWERLEDTEST Interactive
402 DEBUGLEDTEST Interactive
403 STATUSLEDTEST Interactive
404 OPTMODLEDCONTROLTEST Interactive
405 FIXEDLEDCONTROLTEST Interactive
406 RTCBATTERYTEST Interactive
407 CPLDRESETTEST Interactive
408 I2CDEVICESCANTEST Interactive
409 SERVERPORTPHYEXTLINKTEST Interactive
410 CPUSNAKEQSFPPEXTLPBKTEST Interactive
411 CPUSNAKEOPTMODEXTLPBKTEST Interactive
Total Diagnostic Testcases in Interactive: 11
************************************* END
**************************************
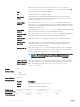
show hardware stack-unit
Display the data plane or management plane input and output statistics of the designated component of the designated stack member.
Syntax
show hardware stack-unit 0-5 {buffer [buffer unit | port [(1-56) | all] total
buffer | buffer unit (1) port (1-56) queue [(0-14) | a11] buffer-info} {phy-
firmware-version} {cpu data-plane statistics [stack-port 0-52] | cpu party-bus
statistics | cpu private-mgmt statistics | drops [unit 0-1 [port 1-56]] |
stack-port 33-56 | unit 0-0 {counters | details | port-stats [detail] |
register}}
show hardware stack-unit 0-5 {buffer [ unit 0 ] total buffer | buffer unit 0
interface all queue [(0-14) | a11] buffer-info} {phy-firmware-version} {cpu
data-plane statistics [stack-port 0-52] | cpu party-bus statistics | cpu
private-mgmt statistics | drops [unit 0-1 ] | stack-port 33-56 | unit 0-0
{counters | details | port-stats [detail] | register}}
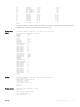
Parameters
stack-unit 0–5
{command-option}
Enter the keywords stack-unit then 0 to 5 to select a particular stack member and
then enter one of the following command options to display a collection of data based on
the option entered.
buffer Enter the keyword buffer. To display buffer statistics for a all interface, enter the
keyword interface followed by the keyword all. To display the forwarding plane
statistics containing the packet buffer usage per port per stack unit, enter the keyword
unit then 0 for port-pipe 0, then port and the port number (42-53, and then
buffer-info.
buffer Enter the keyword buffer. To display the total buffer statistics for the stack unit, enter
the keyword total-buffer. Enter the keywords buffer unit then total-
buffer
to display the buffer details per unit and mode of allocation. To display the
forwarding plane statistics containing the packet buffer usage per port per stack unit,
enter the keywords buffer unit then port and the port number (1-56 or all),
then buffer-info. To display the forwarding plane statistics containing the packet
Debugging and Diagnostics 431